European vs Australian In Labor Force | Age 35-44
COMPARE
European
Australian
In Labor Force | Age 35-44
In Labor Force | Age 35-44 Comparison
Europeans
Australians
84.1%
IN LABOR FORCE | AGE 35-44
12.2/ 100
METRIC RATING
215th/ 347
METRIC RANK
84.3%
IN LABOR FORCE | AGE 35-44
35.1/ 100
METRIC RATING
186th/ 347
METRIC RANK
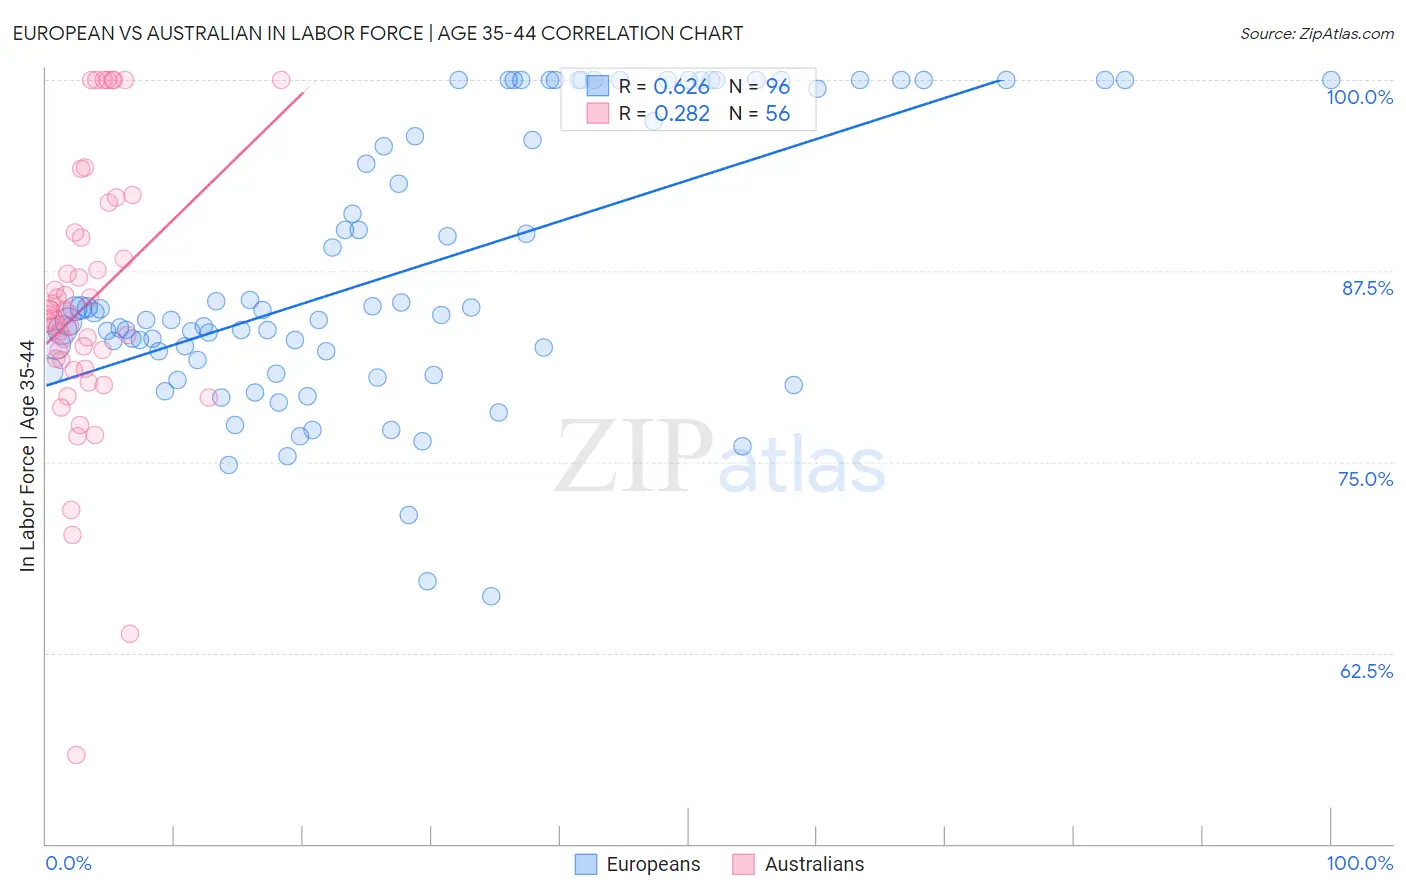
European vs Australian In Labor Force | Age 35-44 Correlation Chart
The statistical analysis conducted on geographies consisting of 561,223,760 people shows a significant positive correlation between the proportion of Europeans and labor force participation rate among population between the ages 35 and 44 in the United States with a correlation coefficient (R) of 0.626 and weighted average of 84.1%. Similarly, the statistical analysis conducted on geographies consisting of 224,086,573 people shows a weak positive correlation between the proportion of Australians and labor force participation rate among population between the ages 35 and 44 in the United States with a correlation coefficient (R) of 0.282 and weighted average of 84.3%, a difference of 0.22%.
In Labor Force | Age 35-44 Correlation Summary
| Measurement | European | Australian |
| Minimum | 66.2% | 55.8% |
| Maximum | 100.0% | 100.0% |
| Range | 33.8% | 44.2% |
| Mean | 87.6% | 85.4% |
| Median | 84.7% | 84.5% |
| Interquartile 25% (IQ1) | 81.9% | 81.4% |
| Interquartile 75% (IQ3) | 99.7% | 89.8% |
| Interquartile Range (IQR) | 17.8% | 8.5% |
| Standard Deviation (Sample) | 9.0% | 8.9% |
| Standard Deviation (Population) | 8.9% | 8.8% |
Similar Demographics by In Labor Force | Age 35-44
Demographics Similar to Europeans by In Labor Force | Age 35-44
In terms of in labor force | age 35-44, the demographic groups most similar to Europeans are Nicaraguan (84.1%, a difference of 0.0%), Immigrants from Barbados (84.1%, a difference of 0.010%), Immigrants from Norway (84.1%, a difference of 0.010%), Bangladeshi (84.1%, a difference of 0.020%), and Israeli (84.1%, a difference of 0.030%).
| Demographics | Rating | Rank | In Labor Force | Age 35-44 |
| Immigrants | North America | 18.1 /100 | #208 | Poor 84.2% |
| Swiss | 17.4 /100 | #209 | Poor 84.2% |
| New Zealanders | 16.2 /100 | #210 | Poor 84.1% |
| Immigrants | Ecuador | 15.2 /100 | #211 | Poor 84.1% |
| Israelis | 14.0 /100 | #212 | Poor 84.1% |
| Bangladeshis | 13.7 /100 | #213 | Poor 84.1% |
| Immigrants | Barbados | 13.2 /100 | #214 | Poor 84.1% |
| Europeans | 12.2 /100 | #215 | Poor 84.1% |
| Nicaraguans | 12.1 /100 | #216 | Poor 84.1% |
| Immigrants | Norway | 11.7 /100 | #217 | Poor 84.1% |
| Immigrants | Nicaragua | 9.4 /100 | #218 | Tragic 84.1% |
| Sub-Saharan Africans | 9.3 /100 | #219 | Tragic 84.1% |
| French | 7.5 /100 | #220 | Tragic 84.0% |
| Icelanders | 6.7 /100 | #221 | Tragic 84.0% |
| Assyrians/Chaldeans/Syriacs | 6.6 /100 | #222 | Tragic 84.0% |
Demographics Similar to Australians by In Labor Force | Age 35-44
In terms of in labor force | age 35-44, the demographic groups most similar to Australians are Armenian (84.3%, a difference of 0.0%), Costa Rican (84.3%, a difference of 0.0%), Dutch (84.3%, a difference of 0.0%), Immigrants from West Indies (84.3%, a difference of 0.010%), and Korean (84.3%, a difference of 0.010%).
| Demographics | Rating | Rank | In Labor Force | Age 35-44 |
| Immigrants | South Africa | 42.8 /100 | #179 | Average 84.3% |
| Danes | 38.8 /100 | #180 | Fair 84.3% |
| Immigrants | West Indies | 36.4 /100 | #181 | Fair 84.3% |
| Koreans | 36.3 /100 | #182 | Fair 84.3% |
| Barbadians | 36.2 /100 | #183 | Fair 84.3% |
| Armenians | 35.6 /100 | #184 | Fair 84.3% |
| Costa Ricans | 35.3 /100 | #185 | Fair 84.3% |
| Australians | 35.1 /100 | #186 | Fair 84.3% |
| Dutch | 34.8 /100 | #187 | Fair 84.3% |
| South Africans | 34.1 /100 | #188 | Fair 84.3% |
| Immigrants | Denmark | 33.7 /100 | #189 | Fair 84.3% |
| Portuguese | 31.9 /100 | #190 | Fair 84.3% |
| Immigrants | Philippines | 27.9 /100 | #191 | Fair 84.2% |
| Immigrants | Vietnam | 27.4 /100 | #192 | Fair 84.2% |
| Hungarians | 26.8 /100 | #193 | Fair 84.2% |