Norwegian vs Yup'ik In Labor Force | Age > 16
COMPARE
Norwegian
Yup'ik
In Labor Force | Age > 16
In Labor Force | Age > 16 Comparison
Norwegians
Yup'ik
65.7%
IN LABOR FORCE | AGE > 16
95.3/ 100
METRIC RATING
125th/ 347
METRIC RANK
62.7%
IN LABOR FORCE | AGE > 16
0.0/ 100
METRIC RATING
316th/ 347
METRIC RANK
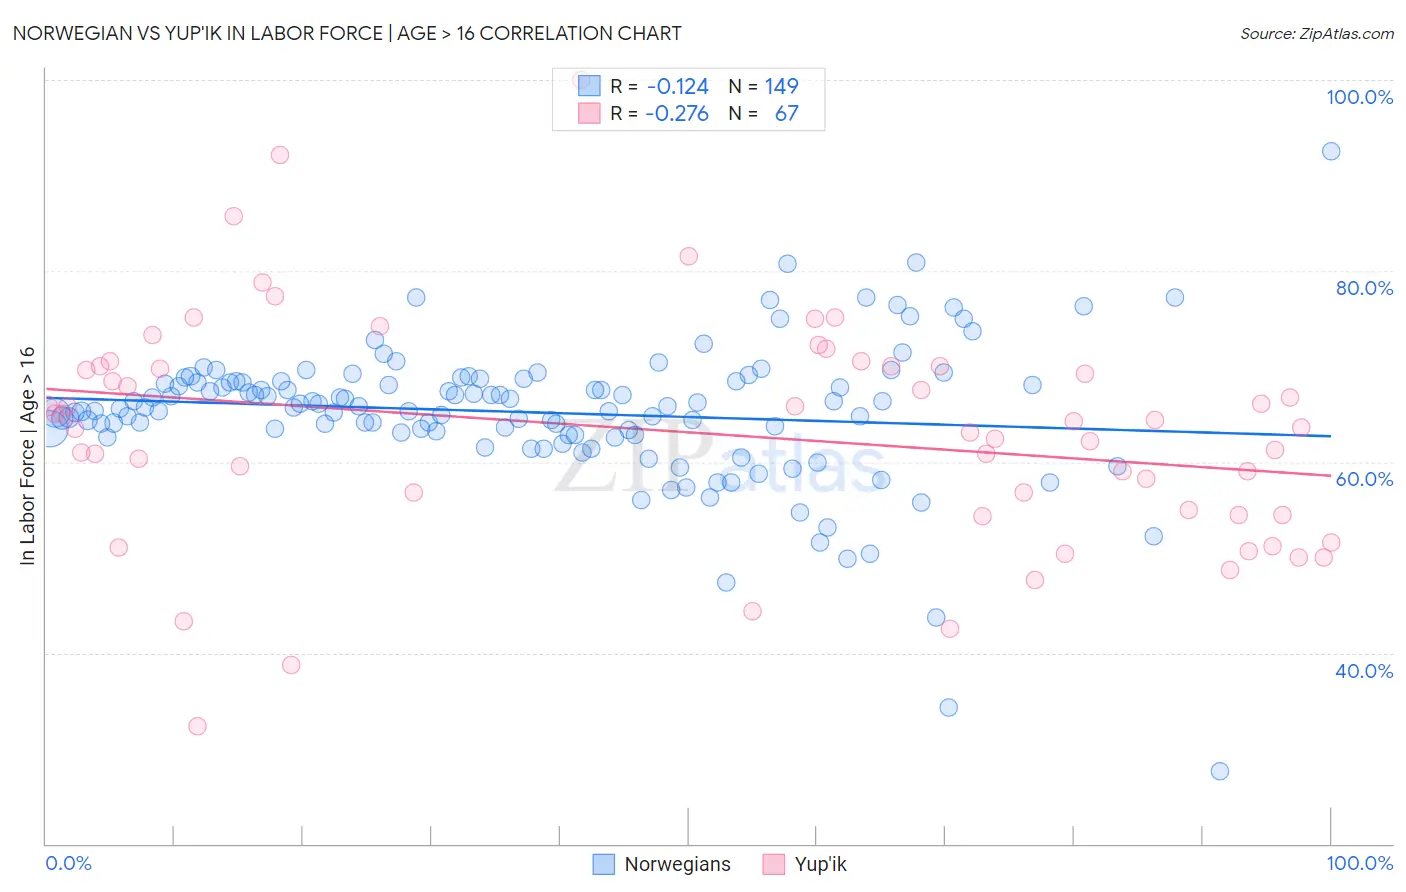
Norwegian vs Yup'ik In Labor Force | Age > 16 Correlation Chart
The statistical analysis conducted on geographies consisting of 533,394,126 people shows a poor negative correlation between the proportion of Norwegians and labor force participation rate among population ages 16 and over in the United States with a correlation coefficient (R) of -0.124 and weighted average of 65.7%. Similarly, the statistical analysis conducted on geographies consisting of 39,964,003 people shows a weak negative correlation between the proportion of Yup'ik and labor force participation rate among population ages 16 and over in the United States with a correlation coefficient (R) of -0.276 and weighted average of 62.7%, a difference of 4.8%.
In Labor Force | Age > 16 Correlation Summary
| Measurement | Norwegian | Yup'ik |
| Minimum | 27.6% | 32.3% |
| Maximum | 92.5% | 100.0% |
| Range | 64.9% | 67.7% |
| Mean | 65.2% | 63.0% |
| Median | 65.8% | 63.6% |
| Interquartile 25% (IQ1) | 62.9% | 54.5% |
| Interquartile 75% (IQ3) | 68.5% | 70.0% |
| Interquartile Range (IQR) | 5.5% | 15.5% |
| Standard Deviation (Sample) | 7.5% | 12.0% |
| Standard Deviation (Population) | 7.5% | 11.9% |
Similar Demographics by In Labor Force | Age > 16
Demographics Similar to Norwegians by In Labor Force | Age > 16
In terms of in labor force | age > 16, the demographic groups most similar to Norwegians are Korean (65.7%, a difference of 0.0%), Immigrants from Iraq (65.7%, a difference of 0.010%), Iraqi (65.7%, a difference of 0.010%), Immigrants from Eastern Asia (65.7%, a difference of 0.030%), and Ecuadorian (65.6%, a difference of 0.030%).
| Demographics | Rating | Rank | In Labor Force | Age > 16 |
| Immigrants | Thailand | 96.6 /100 | #118 | Exceptional 65.7% |
| Immigrants | France | 96.4 /100 | #119 | Exceptional 65.7% |
| Immigrants | Hong Kong | 96.2 /100 | #120 | Exceptional 65.7% |
| New Zealanders | 96.0 /100 | #121 | Exceptional 65.7% |
| Immigrants | Ecuador | 95.9 /100 | #122 | Exceptional 65.7% |
| Immigrants | Iraq | 95.5 /100 | #123 | Exceptional 65.7% |
| Iraqis | 95.4 /100 | #124 | Exceptional 65.7% |
| Norwegians | 95.3 /100 | #125 | Exceptional 65.7% |
| Koreans | 95.3 /100 | #126 | Exceptional 65.7% |
| Immigrants | Eastern Asia | 94.9 /100 | #127 | Exceptional 65.7% |
| Ecuadorians | 94.7 /100 | #128 | Exceptional 65.6% |
| Immigrants | Philippines | 94.5 /100 | #129 | Exceptional 65.6% |
| Immigrants | Guatemala | 94.4 /100 | #130 | Exceptional 65.6% |
| Icelanders | 94.3 /100 | #131 | Exceptional 65.6% |
| Immigrants | North Macedonia | 94.1 /100 | #132 | Exceptional 65.6% |
Demographics Similar to Yup'ik by In Labor Force | Age > 16
In terms of in labor force | age > 16, the demographic groups most similar to Yup'ik are Potawatomi (62.8%, a difference of 0.22%), Kiowa (62.4%, a difference of 0.45%), Yaqui (63.0%, a difference of 0.56%), Chickasaw (62.3%, a difference of 0.64%), and Chippewa (63.1%, a difference of 0.66%).
| Demographics | Rating | Rank | In Labor Force | Age > 16 |
| Scotch-Irish | 0.0 /100 | #309 | Tragic 63.3% |
| Shoshone | 0.0 /100 | #310 | Tragic 63.2% |
| Blackfeet | 0.0 /100 | #311 | Tragic 63.2% |
| Iroquois | 0.0 /100 | #312 | Tragic 63.2% |
| Chippewa | 0.0 /100 | #313 | Tragic 63.1% |
| Yaqui | 0.0 /100 | #314 | Tragic 63.0% |
| Potawatomi | 0.0 /100 | #315 | Tragic 62.8% |
| Yup'ik | 0.0 /100 | #316 | Tragic 62.7% |
| Kiowa | 0.0 /100 | #317 | Tragic 62.4% |
| Chickasaw | 0.0 /100 | #318 | Tragic 62.3% |
| Arapaho | 0.0 /100 | #319 | Tragic 62.1% |
| Yakama | 0.0 /100 | #320 | Tragic 62.1% |
| Americans | 0.0 /100 | #321 | Tragic 62.1% |
| Ottawa | 0.0 /100 | #322 | Tragic 62.0% |
| Seminole | 0.0 /100 | #323 | Tragic 62.0% |