Polish vs Yup'ik In Labor Force | Age > 16
COMPARE
Polish
Yup'ik
In Labor Force | Age > 16
In Labor Force | Age > 16 Comparison
Poles
Yup'ik
64.7%
IN LABOR FORCE | AGE > 16
8.3/ 100
METRIC RATING
227th/ 347
METRIC RANK
62.7%
IN LABOR FORCE | AGE > 16
0.0/ 100
METRIC RATING
316th/ 347
METRIC RANK
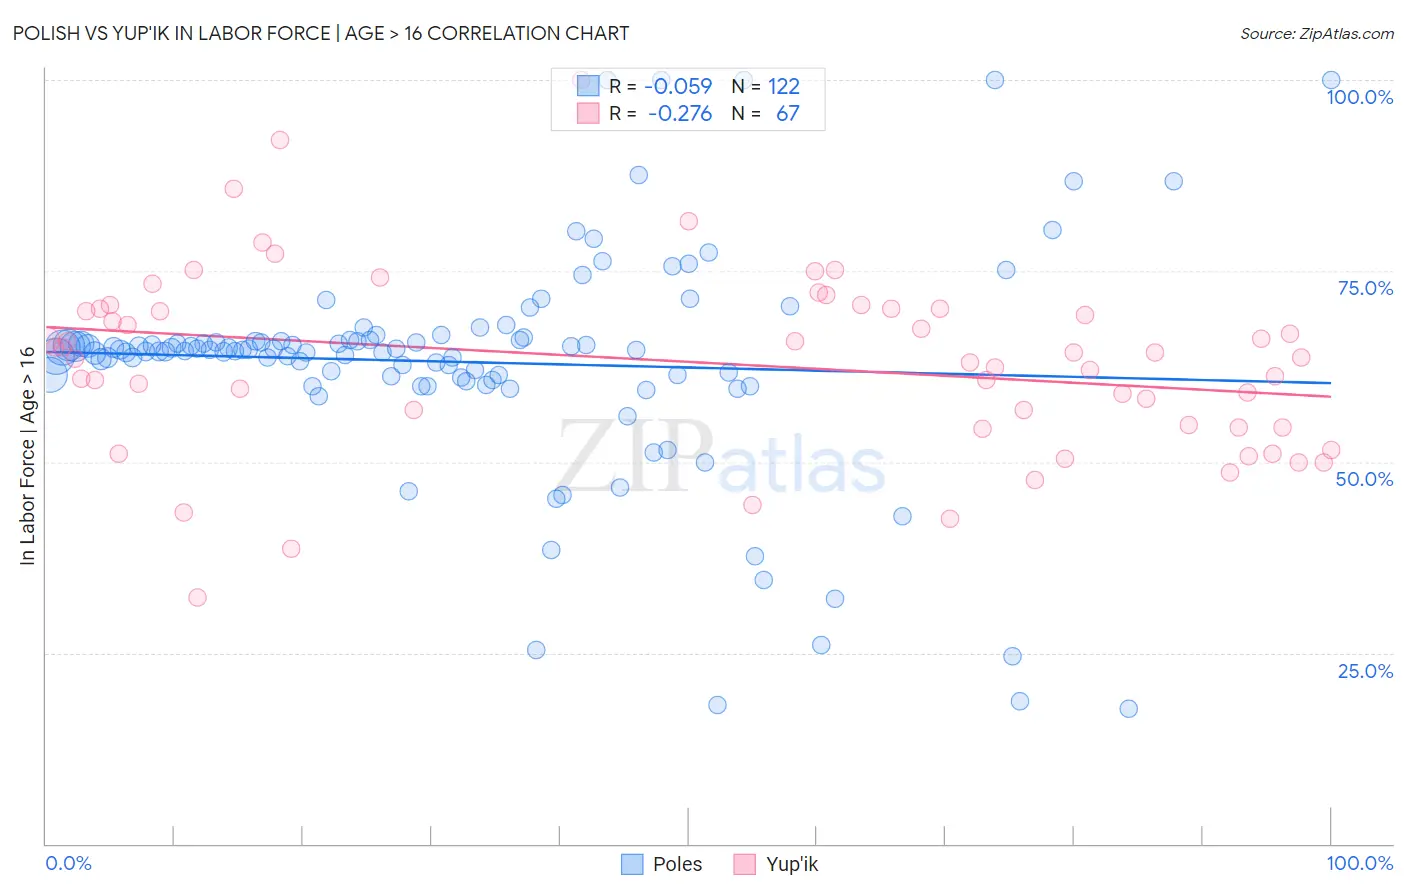
Polish vs Yup'ik In Labor Force | Age > 16 Correlation Chart
The statistical analysis conducted on geographies consisting of 560,604,274 people shows a slight negative correlation between the proportion of Poles and labor force participation rate among population ages 16 and over in the United States with a correlation coefficient (R) of -0.059 and weighted average of 64.7%. Similarly, the statistical analysis conducted on geographies consisting of 39,964,003 people shows a weak negative correlation between the proportion of Yup'ik and labor force participation rate among population ages 16 and over in the United States with a correlation coefficient (R) of -0.276 and weighted average of 62.7%, a difference of 3.2%.
In Labor Force | Age > 16 Correlation Summary
| Measurement | Polish | Yup'ik |
| Minimum | 17.6% | 32.3% |
| Maximum | 100.0% | 100.0% |
| Range | 82.4% | 67.7% |
| Mean | 63.1% | 63.0% |
| Median | 64.6% | 63.6% |
| Interquartile 25% (IQ1) | 61.1% | 54.5% |
| Interquartile 75% (IQ3) | 65.9% | 70.0% |
| Interquartile Range (IQR) | 4.9% | 15.5% |
| Standard Deviation (Sample) | 14.8% | 12.0% |
| Standard Deviation (Population) | 14.8% | 11.9% |
Similar Demographics by In Labor Force | Age > 16
Demographics Similar to Poles by In Labor Force | Age > 16
In terms of in labor force | age > 16, the demographic groups most similar to Poles are European (64.7%, a difference of 0.0%), Northern European (64.7%, a difference of 0.0%), Immigrants from Jamaica (64.7%, a difference of 0.020%), Croatian (64.7%, a difference of 0.020%), and Immigrants from Belize (64.7%, a difference of 0.030%).
| Demographics | Rating | Rank | In Labor Force | Age > 16 |
| Alaska Natives | 9.9 /100 | #220 | Tragic 64.7% |
| Immigrants | Micronesia | 9.6 /100 | #221 | Tragic 64.7% |
| Hawaiians | 9.3 /100 | #222 | Tragic 64.7% |
| Immigrants | Belize | 9.2 /100 | #223 | Tragic 64.7% |
| Immigrants | Jamaica | 8.8 /100 | #224 | Tragic 64.7% |
| Croatians | 8.8 /100 | #225 | Tragic 64.7% |
| Europeans | 8.3 /100 | #226 | Tragic 64.7% |
| Poles | 8.3 /100 | #227 | Tragic 64.7% |
| Northern Europeans | 8.2 /100 | #228 | Tragic 64.7% |
| British | 7.3 /100 | #229 | Tragic 64.7% |
| Chinese | 7.3 /100 | #230 | Tragic 64.7% |
| Immigrants | Northern Europe | 7.2 /100 | #231 | Tragic 64.7% |
| Africans | 5.8 /100 | #232 | Tragic 64.6% |
| Slavs | 4.9 /100 | #233 | Tragic 64.6% |
| Vietnamese | 4.7 /100 | #234 | Tragic 64.6% |
Demographics Similar to Yup'ik by In Labor Force | Age > 16
In terms of in labor force | age > 16, the demographic groups most similar to Yup'ik are Potawatomi (62.8%, a difference of 0.22%), Kiowa (62.4%, a difference of 0.45%), Yaqui (63.0%, a difference of 0.56%), Chickasaw (62.3%, a difference of 0.64%), and Chippewa (63.1%, a difference of 0.66%).
| Demographics | Rating | Rank | In Labor Force | Age > 16 |
| Scotch-Irish | 0.0 /100 | #309 | Tragic 63.3% |
| Shoshone | 0.0 /100 | #310 | Tragic 63.2% |
| Blackfeet | 0.0 /100 | #311 | Tragic 63.2% |
| Iroquois | 0.0 /100 | #312 | Tragic 63.2% |
| Chippewa | 0.0 /100 | #313 | Tragic 63.1% |
| Yaqui | 0.0 /100 | #314 | Tragic 63.0% |
| Potawatomi | 0.0 /100 | #315 | Tragic 62.8% |
| Yup'ik | 0.0 /100 | #316 | Tragic 62.7% |
| Kiowa | 0.0 /100 | #317 | Tragic 62.4% |
| Chickasaw | 0.0 /100 | #318 | Tragic 62.3% |
| Arapaho | 0.0 /100 | #319 | Tragic 62.1% |
| Yakama | 0.0 /100 | #320 | Tragic 62.1% |
| Americans | 0.0 /100 | #321 | Tragic 62.1% |
| Ottawa | 0.0 /100 | #322 | Tragic 62.0% |
| Seminole | 0.0 /100 | #323 | Tragic 62.0% |