Norwegian vs Immigrants from Nepal In Labor Force | Age > 16
COMPARE
Norwegian
Immigrants from Nepal
In Labor Force | Age > 16
In Labor Force | Age > 16 Comparison
Norwegians
Immigrants from Nepal
65.7%
IN LABOR FORCE | AGE > 16
95.3/ 100
METRIC RATING
125th/ 347
METRIC RANK
68.0%
IN LABOR FORCE | AGE > 16
100.0/ 100
METRIC RATING
13th/ 347
METRIC RANK
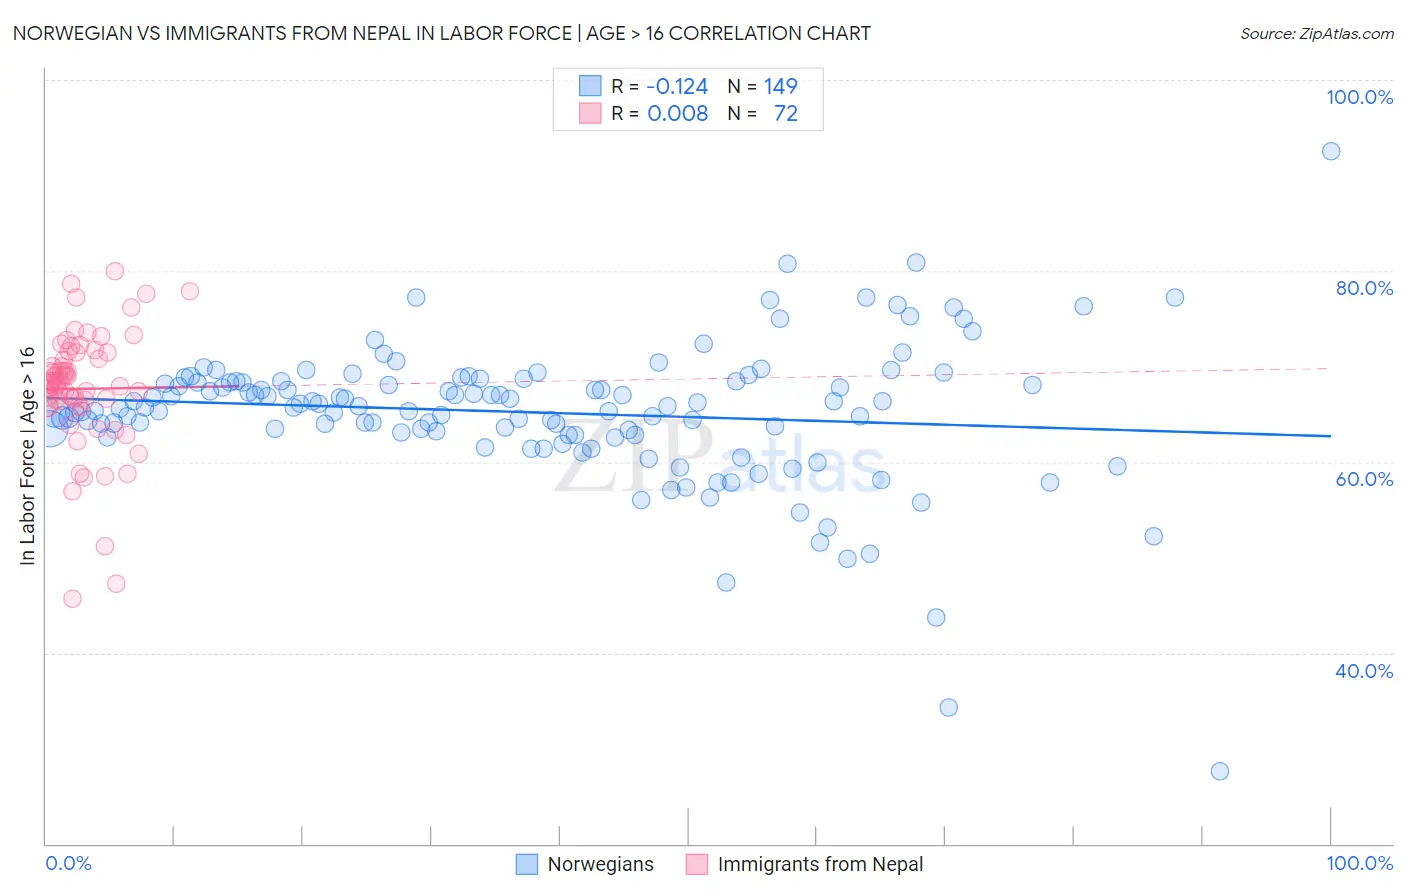
Norwegian vs Immigrants from Nepal In Labor Force | Age > 16 Correlation Chart
The statistical analysis conducted on geographies consisting of 533,394,126 people shows a poor negative correlation between the proportion of Norwegians and labor force participation rate among population ages 16 and over in the United States with a correlation coefficient (R) of -0.124 and weighted average of 65.7%. Similarly, the statistical analysis conducted on geographies consisting of 186,792,250 people shows no correlation between the proportion of Immigrants from Nepal and labor force participation rate among population ages 16 and over in the United States with a correlation coefficient (R) of 0.008 and weighted average of 68.0%, a difference of 3.6%.
In Labor Force | Age > 16 Correlation Summary
| Measurement | Norwegian | Immigrants from Nepal |
| Minimum | 27.6% | 45.6% |
| Maximum | 92.5% | 80.0% |
| Range | 64.9% | 34.4% |
| Mean | 65.2% | 67.7% |
| Median | 65.8% | 68.3% |
| Interquartile 25% (IQ1) | 62.9% | 66.1% |
| Interquartile 75% (IQ3) | 68.5% | 71.1% |
| Interquartile Range (IQR) | 5.5% | 5.0% |
| Standard Deviation (Sample) | 7.5% | 6.3% |
| Standard Deviation (Population) | 7.5% | 6.2% |
Similar Demographics by In Labor Force | Age > 16
Demographics Similar to Norwegians by In Labor Force | Age > 16
In terms of in labor force | age > 16, the demographic groups most similar to Norwegians are Korean (65.7%, a difference of 0.0%), Immigrants from Iraq (65.7%, a difference of 0.010%), Iraqi (65.7%, a difference of 0.010%), Immigrants from Eastern Asia (65.7%, a difference of 0.030%), and Ecuadorian (65.6%, a difference of 0.030%).
| Demographics | Rating | Rank | In Labor Force | Age > 16 |
| Immigrants | Thailand | 96.6 /100 | #118 | Exceptional 65.7% |
| Immigrants | France | 96.4 /100 | #119 | Exceptional 65.7% |
| Immigrants | Hong Kong | 96.2 /100 | #120 | Exceptional 65.7% |
| New Zealanders | 96.0 /100 | #121 | Exceptional 65.7% |
| Immigrants | Ecuador | 95.9 /100 | #122 | Exceptional 65.7% |
| Immigrants | Iraq | 95.5 /100 | #123 | Exceptional 65.7% |
| Iraqis | 95.4 /100 | #124 | Exceptional 65.7% |
| Norwegians | 95.3 /100 | #125 | Exceptional 65.7% |
| Koreans | 95.3 /100 | #126 | Exceptional 65.7% |
| Immigrants | Eastern Asia | 94.9 /100 | #127 | Exceptional 65.7% |
| Ecuadorians | 94.7 /100 | #128 | Exceptional 65.6% |
| Immigrants | Philippines | 94.5 /100 | #129 | Exceptional 65.6% |
| Immigrants | Guatemala | 94.4 /100 | #130 | Exceptional 65.6% |
| Icelanders | 94.3 /100 | #131 | Exceptional 65.6% |
| Immigrants | North Macedonia | 94.1 /100 | #132 | Exceptional 65.6% |
Demographics Similar to Immigrants from Nepal by In Labor Force | Age > 16
In terms of in labor force | age > 16, the demographic groups most similar to Immigrants from Nepal are Sudanese (68.0%, a difference of 0.020%), Bolivian (68.2%, a difference of 0.24%), Liberian (67.8%, a difference of 0.36%), Immigrants from Middle Africa (67.7%, a difference of 0.42%), and Immigrants from Sudan (67.7%, a difference of 0.53%).
| Demographics | Rating | Rank | In Labor Force | Age > 16 |
| Immigrants | Eritrea | 100.0 /100 | #6 | Exceptional 68.9% |
| Immigrants | Cameroon | 100.0 /100 | #7 | Exceptional 68.7% |
| Immigrants | Sierra Leone | 100.0 /100 | #8 | Exceptional 68.5% |
| Immigrants | Eastern Africa | 100.0 /100 | #9 | Exceptional 68.5% |
| Immigrants | Bolivia | 100.0 /100 | #10 | Exceptional 68.4% |
| Bolivians | 100.0 /100 | #11 | Exceptional 68.2% |
| Sudanese | 100.0 /100 | #12 | Exceptional 68.0% |
| Immigrants | Nepal | 100.0 /100 | #13 | Exceptional 68.0% |
| Liberians | 100.0 /100 | #14 | Exceptional 67.8% |
| Immigrants | Middle Africa | 100.0 /100 | #15 | Exceptional 67.7% |
| Immigrants | Sudan | 100.0 /100 | #16 | Exceptional 67.7% |
| Immigrants | India | 100.0 /100 | #17 | Exceptional 67.6% |
| Immigrants | Liberia | 100.0 /100 | #18 | Exceptional 67.6% |
| Kenyans | 100.0 /100 | #19 | Exceptional 67.6% |
| Immigrants | Kenya | 100.0 /100 | #20 | Exceptional 67.6% |