Carpatho Rusyn vs Yup'ik In Labor Force | Age > 16
COMPARE
Carpatho Rusyn
Yup'ik
In Labor Force | Age > 16
In Labor Force | Age > 16 Comparison
Carpatho Rusyns
Yup'ik
65.0%
IN LABOR FORCE | AGE > 16
40.0/ 100
METRIC RATING
184th/ 347
METRIC RANK
62.7%
IN LABOR FORCE | AGE > 16
0.0/ 100
METRIC RATING
316th/ 347
METRIC RANK
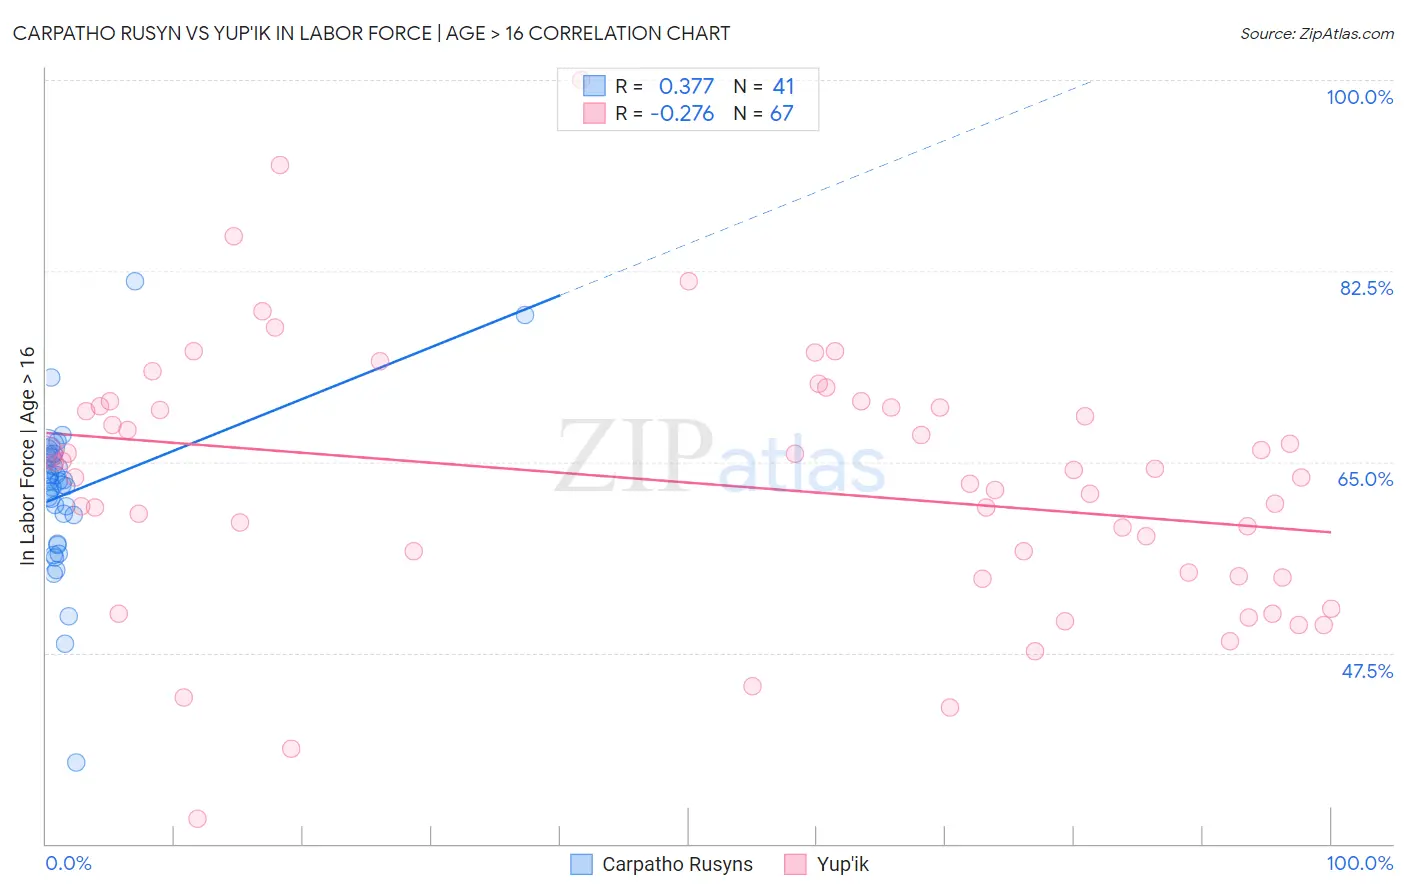
Carpatho Rusyn vs Yup'ik In Labor Force | Age > 16 Correlation Chart
The statistical analysis conducted on geographies consisting of 58,872,150 people shows a mild positive correlation between the proportion of Carpatho Rusyns and labor force participation rate among population ages 16 and over in the United States with a correlation coefficient (R) of 0.377 and weighted average of 65.0%. Similarly, the statistical analysis conducted on geographies consisting of 39,964,003 people shows a weak negative correlation between the proportion of Yup'ik and labor force participation rate among population ages 16 and over in the United States with a correlation coefficient (R) of -0.276 and weighted average of 62.7%, a difference of 3.8%.
In Labor Force | Age > 16 Correlation Summary
| Measurement | Carpatho Rusyn | Yup'ik |
| Minimum | 37.5% | 32.3% |
| Maximum | 81.5% | 100.0% |
| Range | 44.0% | 67.7% |
| Mean | 62.2% | 63.0% |
| Median | 63.2% | 63.6% |
| Interquartile 25% (IQ1) | 58.8% | 54.5% |
| Interquartile 75% (IQ3) | 65.5% | 70.0% |
| Interquartile Range (IQR) | 6.7% | 15.5% |
| Standard Deviation (Sample) | 7.3% | 12.0% |
| Standard Deviation (Population) | 7.2% | 11.9% |
Similar Demographics by In Labor Force | Age > 16
Demographics Similar to Carpatho Rusyns by In Labor Force | Age > 16
In terms of in labor force | age > 16, the demographic groups most similar to Carpatho Rusyns are Syrian (65.0%, a difference of 0.0%), Immigrants from Nicaragua (65.1%, a difference of 0.010%), Soviet Union (65.0%, a difference of 0.010%), Immigrants from Switzerland (65.0%, a difference of 0.020%), and Immigrants from Latvia (65.1%, a difference of 0.030%).
| Demographics | Rating | Rank | In Labor Force | Age > 16 |
| Eastern Europeans | 46.2 /100 | #177 | Average 65.1% |
| Trinidadians and Tobagonians | 45.2 /100 | #178 | Average 65.1% |
| Immigrants | Haiti | 43.3 /100 | #179 | Average 65.1% |
| Immigrants | Latvia | 42.9 /100 | #180 | Average 65.1% |
| Immigrants | Panama | 42.4 /100 | #181 | Average 65.1% |
| Immigrants | Nicaragua | 41.1 /100 | #182 | Average 65.1% |
| Soviet Union | 40.5 /100 | #183 | Average 65.0% |
| Carpatho Rusyns | 40.0 /100 | #184 | Average 65.0% |
| Syrians | 40.0 /100 | #185 | Average 65.0% |
| Immigrants | Switzerland | 38.2 /100 | #186 | Fair 65.0% |
| Immigrants | Croatia | 35.7 /100 | #187 | Fair 65.0% |
| Immigrants | Portugal | 34.8 /100 | #188 | Fair 65.0% |
| Immigrants | Greece | 34.3 /100 | #189 | Fair 65.0% |
| Barbadians | 33.9 /100 | #190 | Fair 65.0% |
| Scandinavians | 33.7 /100 | #191 | Fair 65.0% |
Demographics Similar to Yup'ik by In Labor Force | Age > 16
In terms of in labor force | age > 16, the demographic groups most similar to Yup'ik are Potawatomi (62.8%, a difference of 0.22%), Kiowa (62.4%, a difference of 0.45%), Yaqui (63.0%, a difference of 0.56%), Chickasaw (62.3%, a difference of 0.64%), and Chippewa (63.1%, a difference of 0.66%).
| Demographics | Rating | Rank | In Labor Force | Age > 16 |
| Scotch-Irish | 0.0 /100 | #309 | Tragic 63.3% |
| Shoshone | 0.0 /100 | #310 | Tragic 63.2% |
| Blackfeet | 0.0 /100 | #311 | Tragic 63.2% |
| Iroquois | 0.0 /100 | #312 | Tragic 63.2% |
| Chippewa | 0.0 /100 | #313 | Tragic 63.1% |
| Yaqui | 0.0 /100 | #314 | Tragic 63.0% |
| Potawatomi | 0.0 /100 | #315 | Tragic 62.8% |
| Yup'ik | 0.0 /100 | #316 | Tragic 62.7% |
| Kiowa | 0.0 /100 | #317 | Tragic 62.4% |
| Chickasaw | 0.0 /100 | #318 | Tragic 62.3% |
| Arapaho | 0.0 /100 | #319 | Tragic 62.1% |
| Yakama | 0.0 /100 | #320 | Tragic 62.1% |
| Americans | 0.0 /100 | #321 | Tragic 62.1% |
| Ottawa | 0.0 /100 | #322 | Tragic 62.0% |
| Seminole | 0.0 /100 | #323 | Tragic 62.0% |