Norwegian vs Immigrants from Romania In Labor Force | Age > 16
COMPARE
Norwegian
Immigrants from Romania
In Labor Force | Age > 16
In Labor Force | Age > 16 Comparison
Norwegians
Immigrants from Romania
65.7%
IN LABOR FORCE | AGE > 16
95.3/ 100
METRIC RATING
125th/ 347
METRIC RANK
65.5%
IN LABOR FORCE | AGE > 16
88.6/ 100
METRIC RATING
144th/ 347
METRIC RANK
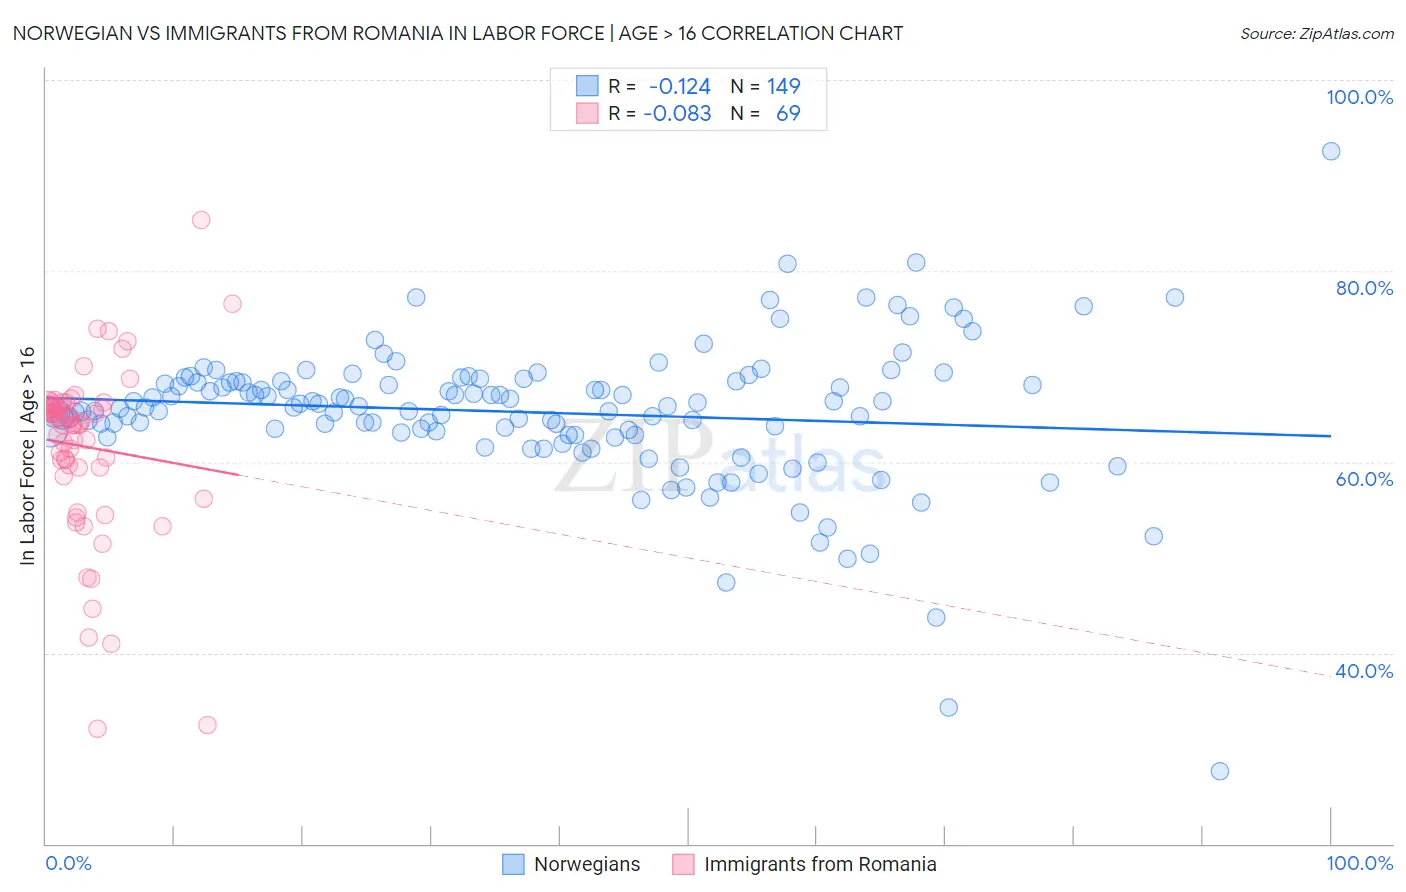
Norwegian vs Immigrants from Romania In Labor Force | Age > 16 Correlation Chart
The statistical analysis conducted on geographies consisting of 533,394,126 people shows a poor negative correlation between the proportion of Norwegians and labor force participation rate among population ages 16 and over in the United States with a correlation coefficient (R) of -0.124 and weighted average of 65.7%. Similarly, the statistical analysis conducted on geographies consisting of 257,014,238 people shows a slight negative correlation between the proportion of Immigrants from Romania and labor force participation rate among population ages 16 and over in the United States with a correlation coefficient (R) of -0.083 and weighted average of 65.5%, a difference of 0.27%.
In Labor Force | Age > 16 Correlation Summary
| Measurement | Norwegian | Immigrants from Romania |
| Minimum | 27.6% | 32.1% |
| Maximum | 92.5% | 85.3% |
| Range | 64.9% | 53.2% |
| Mean | 65.2% | 61.6% |
| Median | 65.8% | 64.3% |
| Interquartile 25% (IQ1) | 62.9% | 59.4% |
| Interquartile 75% (IQ3) | 68.5% | 66.0% |
| Interquartile Range (IQR) | 5.5% | 6.6% |
| Standard Deviation (Sample) | 7.5% | 9.1% |
| Standard Deviation (Population) | 7.5% | 9.0% |
Demographics Similar to Norwegians and Immigrants from Romania by In Labor Force | Age > 16
In terms of in labor force | age > 16, the demographic groups most similar to Norwegians are Korean (65.7%, a difference of 0.0%), Iraqi (65.7%, a difference of 0.010%), Immigrants from Eastern Asia (65.7%, a difference of 0.030%), Ecuadorian (65.6%, a difference of 0.030%), and Immigrants from Philippines (65.6%, a difference of 0.050%). Similarly, the demographic groups most similar to Immigrants from Romania are Indian (Asian) (65.5%, a difference of 0.020%), Latvian (65.5%, a difference of 0.020%), Immigrants from Costa Rica (65.5%, a difference of 0.060%), Samoan (65.5%, a difference of 0.060%), and Immigrants from Taiwan (65.5%, a difference of 0.070%).
| Demographics | Rating | Rank | In Labor Force | Age > 16 |
| Iraqis | 95.4 /100 | #124 | Exceptional 65.7% |
| Norwegians | 95.3 /100 | #125 | Exceptional 65.7% |
| Koreans | 95.3 /100 | #126 | Exceptional 65.7% |
| Immigrants | Eastern Asia | 94.9 /100 | #127 | Exceptional 65.7% |
| Ecuadorians | 94.7 /100 | #128 | Exceptional 65.6% |
| Immigrants | Philippines | 94.5 /100 | #129 | Exceptional 65.6% |
| Immigrants | Guatemala | 94.4 /100 | #130 | Exceptional 65.6% |
| Icelanders | 94.3 /100 | #131 | Exceptional 65.6% |
| Immigrants | North Macedonia | 94.1 /100 | #132 | Exceptional 65.6% |
| Immigrants | Lithuania | 93.5 /100 | #133 | Exceptional 65.6% |
| Costa Ricans | 93.2 /100 | #134 | Exceptional 65.6% |
| Guatemalans | 92.5 /100 | #135 | Exceptional 65.6% |
| Immigrants | Argentina | 92.4 /100 | #136 | Exceptional 65.6% |
| Guamanians/Chamorros | 92.4 /100 | #137 | Exceptional 65.6% |
| Immigrants | West Indies | 92.0 /100 | #138 | Exceptional 65.6% |
| Immigrants | Taiwan | 90.8 /100 | #139 | Exceptional 65.5% |
| Immigrants | Costa Rica | 90.8 /100 | #140 | Exceptional 65.5% |
| Samoans | 90.5 /100 | #141 | Exceptional 65.5% |
| Indians (Asian) | 89.5 /100 | #142 | Excellent 65.5% |
| Latvians | 89.4 /100 | #143 | Excellent 65.5% |
| Immigrants | Romania | 88.6 /100 | #144 | Excellent 65.5% |