Mexican vs Yup'ik In Labor Force | Age > 16
COMPARE
Mexican
Yup'ik
In Labor Force | Age > 16
In Labor Force | Age > 16 Comparison
Mexicans
Yup'ik
64.1%
IN LABOR FORCE | AGE > 16
0.3/ 100
METRIC RATING
275th/ 347
METRIC RANK
62.7%
IN LABOR FORCE | AGE > 16
0.0/ 100
METRIC RATING
316th/ 347
METRIC RANK
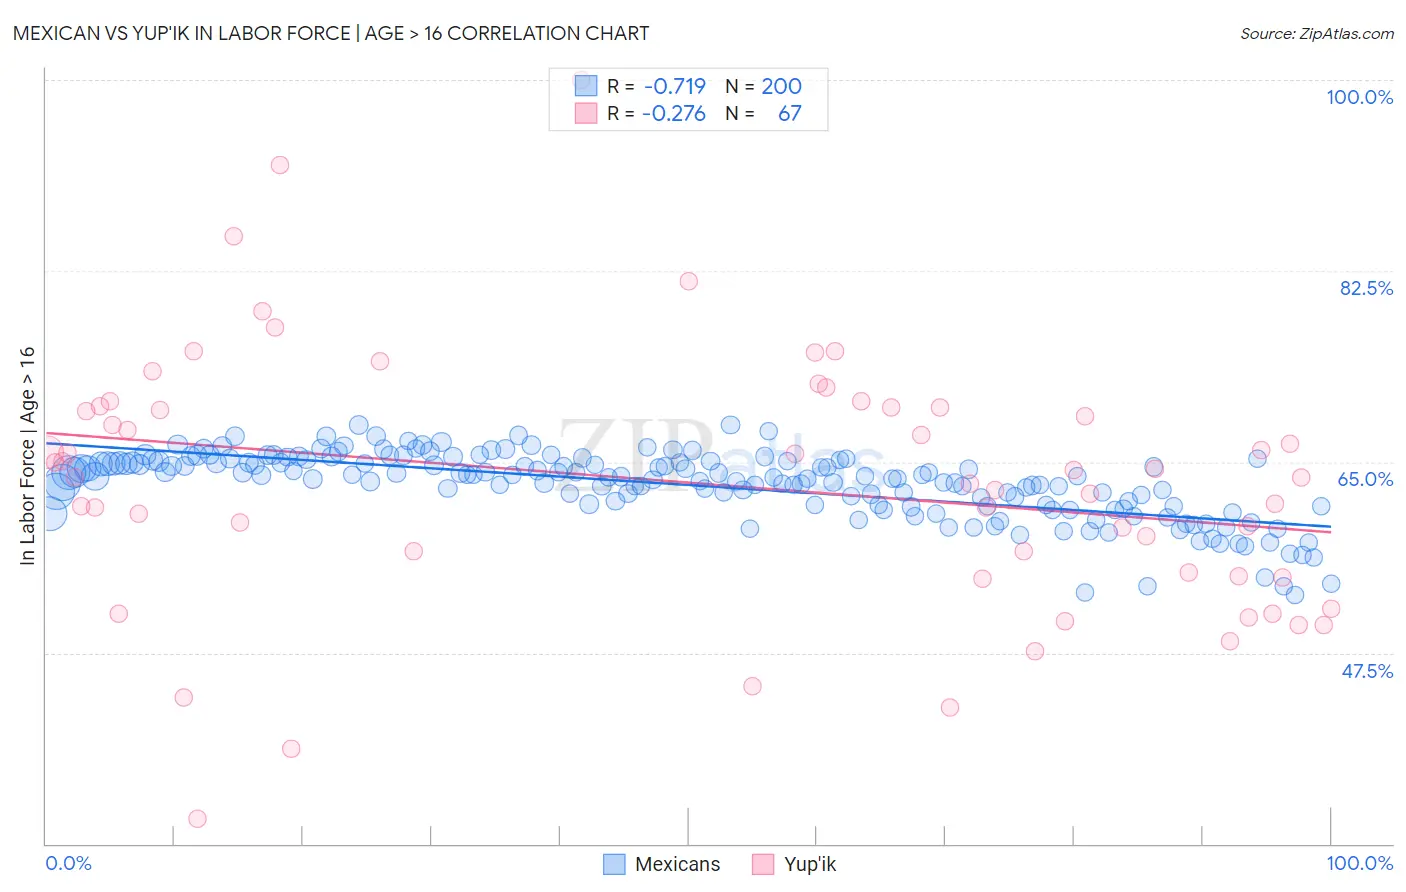
Mexican vs Yup'ik In Labor Force | Age > 16 Correlation Chart
The statistical analysis conducted on geographies consisting of 565,326,570 people shows a strong negative correlation between the proportion of Mexicans and labor force participation rate among population ages 16 and over in the United States with a correlation coefficient (R) of -0.719 and weighted average of 64.1%. Similarly, the statistical analysis conducted on geographies consisting of 39,964,003 people shows a weak negative correlation between the proportion of Yup'ik and labor force participation rate among population ages 16 and over in the United States with a correlation coefficient (R) of -0.276 and weighted average of 62.7%, a difference of 2.2%.
In Labor Force | Age > 16 Correlation Summary
| Measurement | Mexican | Yup'ik |
| Minimum | 52.8% | 32.3% |
| Maximum | 68.4% | 100.0% |
| Range | 15.6% | 67.7% |
| Mean | 62.9% | 63.0% |
| Median | 63.7% | 63.6% |
| Interquartile 25% (IQ1) | 61.0% | 54.5% |
| Interquartile 75% (IQ3) | 65.0% | 70.0% |
| Interquartile Range (IQR) | 4.0% | 15.5% |
| Standard Deviation (Sample) | 3.1% | 12.0% |
| Standard Deviation (Population) | 3.1% | 11.9% |
Similar Demographics by In Labor Force | Age > 16
Demographics Similar to Mexicans by In Labor Force | Age > 16
In terms of in labor force | age > 16, the demographic groups most similar to Mexicans are Immigrants from Cuba (64.1%, a difference of 0.0%), French American Indian (64.1%, a difference of 0.0%), Native Hawaiian (64.1%, a difference of 0.020%), Hmong (64.1%, a difference of 0.020%), and Immigrants from Bahamas (64.0%, a difference of 0.030%).
| Demographics | Rating | Rank | In Labor Force | Age > 16 |
| Spaniards | 0.5 /100 | #268 | Tragic 64.1% |
| Irish | 0.4 /100 | #269 | Tragic 64.1% |
| Guyanese | 0.4 /100 | #270 | Tragic 64.1% |
| Dominicans | 0.4 /100 | #271 | Tragic 64.1% |
| Native Hawaiians | 0.3 /100 | #272 | Tragic 64.1% |
| Hmong | 0.3 /100 | #273 | Tragic 64.1% |
| Immigrants | Cuba | 0.3 /100 | #274 | Tragic 64.1% |
| Mexicans | 0.3 /100 | #275 | Tragic 64.1% |
| French American Indians | 0.3 /100 | #276 | Tragic 64.1% |
| Immigrants | Bahamas | 0.3 /100 | #277 | Tragic 64.0% |
| Assyrians/Chaldeans/Syriacs | 0.3 /100 | #278 | Tragic 64.0% |
| Welsh | 0.2 /100 | #279 | Tragic 64.0% |
| Immigrants | St. Vincent and the Grenadines | 0.2 /100 | #280 | Tragic 64.0% |
| French Canadians | 0.2 /100 | #281 | Tragic 64.0% |
| Immigrants | Guyana | 0.2 /100 | #282 | Tragic 64.0% |
Demographics Similar to Yup'ik by In Labor Force | Age > 16
In terms of in labor force | age > 16, the demographic groups most similar to Yup'ik are Potawatomi (62.8%, a difference of 0.22%), Kiowa (62.4%, a difference of 0.45%), Yaqui (63.0%, a difference of 0.56%), Chickasaw (62.3%, a difference of 0.64%), and Chippewa (63.1%, a difference of 0.66%).
| Demographics | Rating | Rank | In Labor Force | Age > 16 |
| Scotch-Irish | 0.0 /100 | #309 | Tragic 63.3% |
| Shoshone | 0.0 /100 | #310 | Tragic 63.2% |
| Blackfeet | 0.0 /100 | #311 | Tragic 63.2% |
| Iroquois | 0.0 /100 | #312 | Tragic 63.2% |
| Chippewa | 0.0 /100 | #313 | Tragic 63.1% |
| Yaqui | 0.0 /100 | #314 | Tragic 63.0% |
| Potawatomi | 0.0 /100 | #315 | Tragic 62.8% |
| Yup'ik | 0.0 /100 | #316 | Tragic 62.7% |
| Kiowa | 0.0 /100 | #317 | Tragic 62.4% |
| Chickasaw | 0.0 /100 | #318 | Tragic 62.3% |
| Arapaho | 0.0 /100 | #319 | Tragic 62.1% |
| Yakama | 0.0 /100 | #320 | Tragic 62.1% |
| Americans | 0.0 /100 | #321 | Tragic 62.1% |
| Ottawa | 0.0 /100 | #322 | Tragic 62.0% |
| Seminole | 0.0 /100 | #323 | Tragic 62.0% |