New Zealander vs Okinawan In Labor Force | Age 35-44
COMPARE
New Zealander
Okinawan
In Labor Force | Age 35-44
In Labor Force | Age 35-44 Comparison
New Zealanders
Okinawans
84.1%
IN LABOR FORCE | AGE 35-44
16.2/ 100
METRIC RATING
210th/ 347
METRIC RANK
84.5%
IN LABOR FORCE | AGE 35-44
73.5/ 100
METRIC RATING
149th/ 347
METRIC RANK
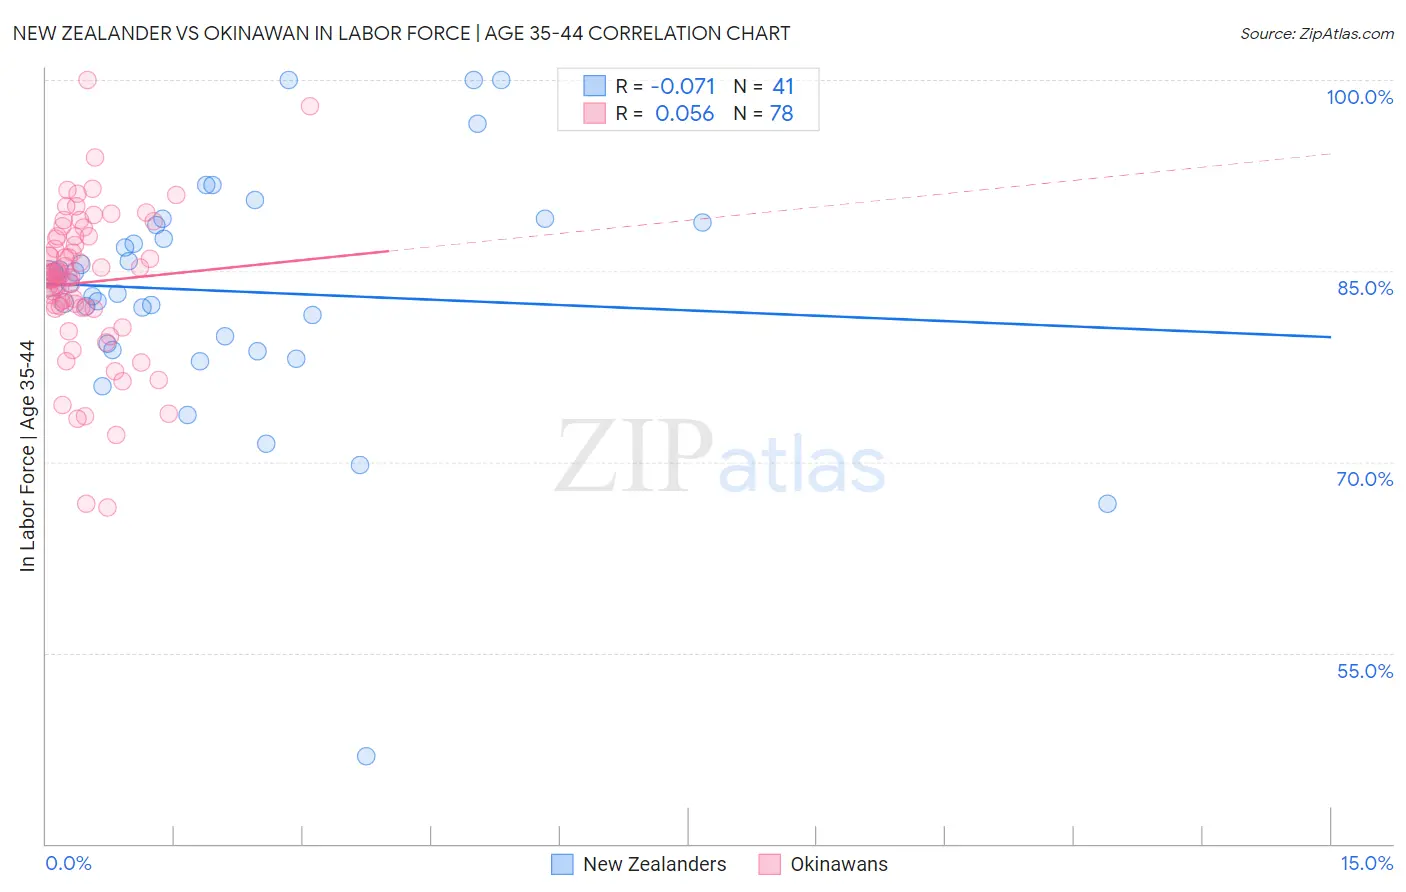
New Zealander vs Okinawan In Labor Force | Age 35-44 Correlation Chart
The statistical analysis conducted on geographies consisting of 106,898,778 people shows a slight negative correlation between the proportion of New Zealanders and labor force participation rate among population between the ages 35 and 44 in the United States with a correlation coefficient (R) of -0.071 and weighted average of 84.1%. Similarly, the statistical analysis conducted on geographies consisting of 73,734,872 people shows a slight positive correlation between the proportion of Okinawans and labor force participation rate among population between the ages 35 and 44 in the United States with a correlation coefficient (R) of 0.056 and weighted average of 84.5%, a difference of 0.43%.
In Labor Force | Age 35-44 Correlation Summary
| Measurement | New Zealander | Okinawan |
| Minimum | 46.9% | 66.4% |
| Maximum | 100.0% | 100.0% |
| Range | 53.1% | 33.6% |
| Mean | 83.4% | 84.1% |
| Median | 84.0% | 84.6% |
| Interquartile 25% (IQ1) | 79.0% | 82.1% |
| Interquartile 75% (IQ3) | 88.7% | 87.7% |
| Interquartile Range (IQR) | 9.7% | 5.6% |
| Standard Deviation (Sample) | 9.5% | 5.9% |
| Standard Deviation (Population) | 9.4% | 5.9% |
Similar Demographics by In Labor Force | Age 35-44
Demographics Similar to New Zealanders by In Labor Force | Age 35-44
In terms of in labor force | age 35-44, the demographic groups most similar to New Zealanders are Swiss (84.2%, a difference of 0.010%), Immigrants from Ecuador (84.1%, a difference of 0.010%), Immigrants from North America (84.2%, a difference of 0.020%), Laotian (84.2%, a difference of 0.030%), and Israeli (84.1%, a difference of 0.030%).
| Demographics | Rating | Rank | In Labor Force | Age 35-44 |
| Immigrants | South Eastern Asia | 22.4 /100 | #203 | Fair 84.2% |
| Canadians | 19.9 /100 | #204 | Poor 84.2% |
| Immigrants | Canada | 19.6 /100 | #205 | Poor 84.2% |
| Immigrants | Costa Rica | 19.5 /100 | #206 | Poor 84.2% |
| Laotians | 19.0 /100 | #207 | Poor 84.2% |
| Immigrants | North America | 18.1 /100 | #208 | Poor 84.2% |
| Swiss | 17.4 /100 | #209 | Poor 84.2% |
| New Zealanders | 16.2 /100 | #210 | Poor 84.1% |
| Immigrants | Ecuador | 15.2 /100 | #211 | Poor 84.1% |
| Israelis | 14.0 /100 | #212 | Poor 84.1% |
| Bangladeshis | 13.7 /100 | #213 | Poor 84.1% |
| Immigrants | Barbados | 13.2 /100 | #214 | Poor 84.1% |
| Europeans | 12.2 /100 | #215 | Poor 84.1% |
| Nicaraguans | 12.1 /100 | #216 | Poor 84.1% |
| Immigrants | Norway | 11.7 /100 | #217 | Poor 84.1% |
Demographics Similar to Okinawans by In Labor Force | Age 35-44
In terms of in labor force | age 35-44, the demographic groups most similar to Okinawans are South American Indian (84.5%, a difference of 0.0%), Immigrants from Nigeria (84.5%, a difference of 0.0%), Romanian (84.5%, a difference of 0.010%), Immigrants from Taiwan (84.5%, a difference of 0.020%), and Immigrants from Netherlands (84.5%, a difference of 0.030%).
| Demographics | Rating | Rank | In Labor Force | Age 35-44 |
| Immigrants | Uruguay | 80.1 /100 | #142 | Excellent 84.6% |
| Immigrants | Ukraine | 79.7 /100 | #143 | Good 84.6% |
| Immigrants | Jamaica | 79.4 /100 | #144 | Good 84.6% |
| Immigrants | Saudi Arabia | 79.4 /100 | #145 | Good 84.6% |
| Immigrants | Asia | 78.7 /100 | #146 | Good 84.5% |
| Immigrants | Netherlands | 76.6 /100 | #147 | Good 84.5% |
| South American Indians | 73.6 /100 | #148 | Good 84.5% |
| Okinawans | 73.5 /100 | #149 | Good 84.5% |
| Immigrants | Nigeria | 73.3 /100 | #150 | Good 84.5% |
| Romanians | 72.1 /100 | #151 | Good 84.5% |
| Immigrants | Taiwan | 71.4 /100 | #152 | Good 84.5% |
| Trinidadians and Tobagonians | 69.5 /100 | #153 | Good 84.5% |
| Iranians | 69.4 /100 | #154 | Good 84.5% |
| Immigrants | Switzerland | 65.9 /100 | #155 | Good 84.5% |
| Immigrants | Israel | 64.3 /100 | #156 | Good 84.4% |