New Zealander vs Cajun In Labor Force | Age 35-44
COMPARE
New Zealander
Cajun
In Labor Force | Age 35-44
In Labor Force | Age 35-44 Comparison
New Zealanders
Cajuns
84.1%
IN LABOR FORCE | AGE 35-44
16.2/ 100
METRIC RATING
210th/ 347
METRIC RANK
81.5%
IN LABOR FORCE | AGE 35-44
0.0/ 100
METRIC RATING
314th/ 347
METRIC RANK
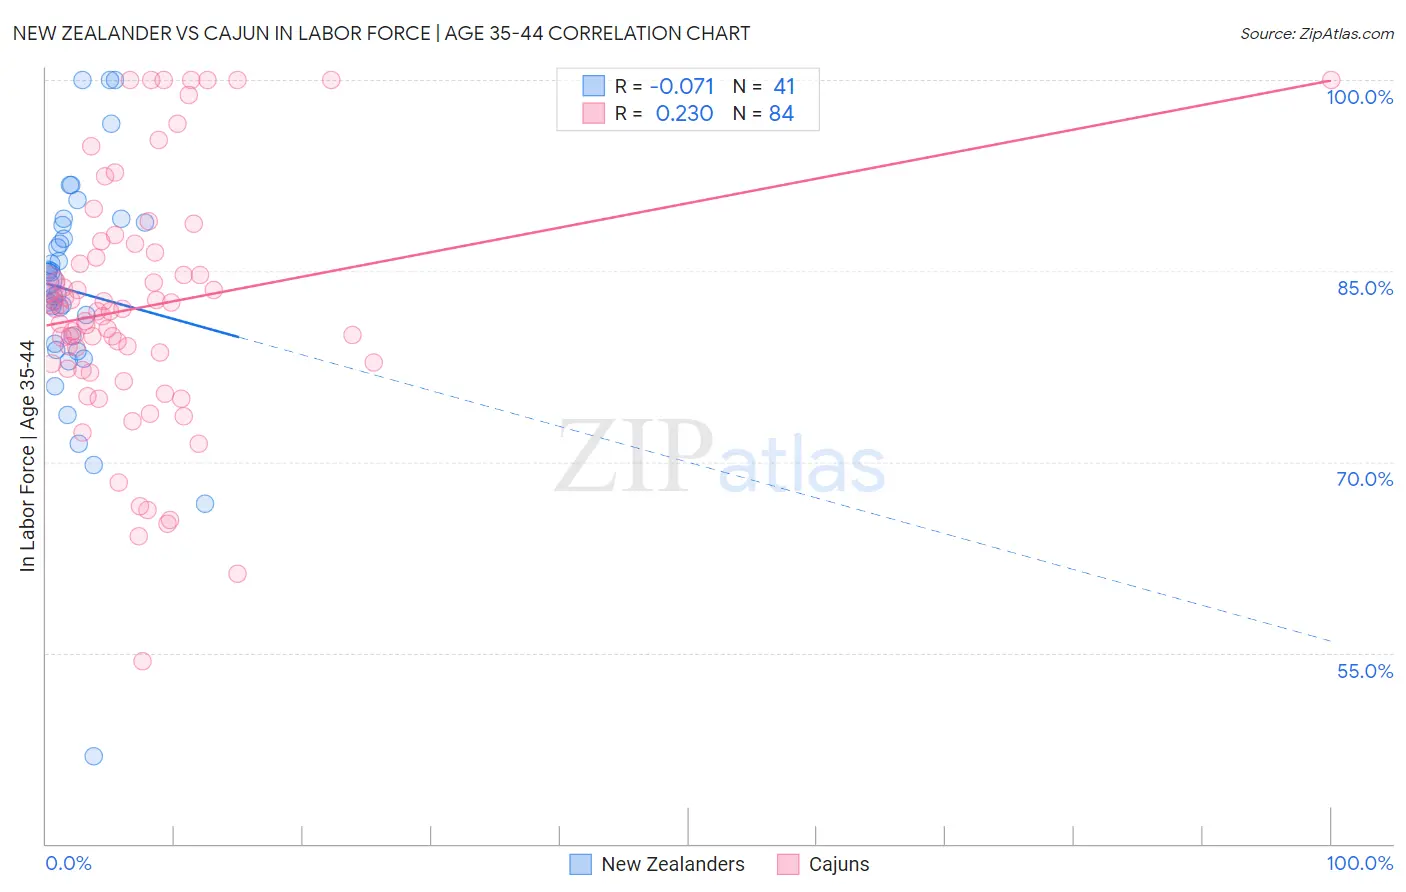
New Zealander vs Cajun In Labor Force | Age 35-44 Correlation Chart
The statistical analysis conducted on geographies consisting of 106,898,778 people shows a slight negative correlation between the proportion of New Zealanders and labor force participation rate among population between the ages 35 and 44 in the United States with a correlation coefficient (R) of -0.071 and weighted average of 84.1%. Similarly, the statistical analysis conducted on geographies consisting of 149,699,850 people shows a weak positive correlation between the proportion of Cajuns and labor force participation rate among population between the ages 35 and 44 in the United States with a correlation coefficient (R) of 0.230 and weighted average of 81.5%, a difference of 3.2%.
In Labor Force | Age 35-44 Correlation Summary
| Measurement | New Zealander | Cajun |
| Minimum | 46.9% | 54.3% |
| Maximum | 100.0% | 100.0% |
| Range | 53.1% | 45.7% |
| Mean | 83.4% | 82.2% |
| Median | 84.0% | 81.9% |
| Interquartile 25% (IQ1) | 79.0% | 77.5% |
| Interquartile 75% (IQ3) | 88.7% | 86.2% |
| Interquartile Range (IQR) | 9.7% | 8.7% |
| Standard Deviation (Sample) | 9.5% | 9.5% |
| Standard Deviation (Population) | 9.4% | 9.5% |
Similar Demographics by In Labor Force | Age 35-44
Demographics Similar to New Zealanders by In Labor Force | Age 35-44
In terms of in labor force | age 35-44, the demographic groups most similar to New Zealanders are Swiss (84.2%, a difference of 0.010%), Immigrants from Ecuador (84.1%, a difference of 0.010%), Immigrants from North America (84.2%, a difference of 0.020%), Laotian (84.2%, a difference of 0.030%), and Israeli (84.1%, a difference of 0.030%).
| Demographics | Rating | Rank | In Labor Force | Age 35-44 |
| Immigrants | South Eastern Asia | 22.4 /100 | #203 | Fair 84.2% |
| Canadians | 19.9 /100 | #204 | Poor 84.2% |
| Immigrants | Canada | 19.6 /100 | #205 | Poor 84.2% |
| Immigrants | Costa Rica | 19.5 /100 | #206 | Poor 84.2% |
| Laotians | 19.0 /100 | #207 | Poor 84.2% |
| Immigrants | North America | 18.1 /100 | #208 | Poor 84.2% |
| Swiss | 17.4 /100 | #209 | Poor 84.2% |
| New Zealanders | 16.2 /100 | #210 | Poor 84.1% |
| Immigrants | Ecuador | 15.2 /100 | #211 | Poor 84.1% |
| Israelis | 14.0 /100 | #212 | Poor 84.1% |
| Bangladeshis | 13.7 /100 | #213 | Poor 84.1% |
| Immigrants | Barbados | 13.2 /100 | #214 | Poor 84.1% |
| Europeans | 12.2 /100 | #215 | Poor 84.1% |
| Nicaraguans | 12.1 /100 | #216 | Poor 84.1% |
| Immigrants | Norway | 11.7 /100 | #217 | Poor 84.1% |
Demographics Similar to Cajuns by In Labor Force | Age 35-44
In terms of in labor force | age 35-44, the demographic groups most similar to Cajuns are Immigrants from Mexico (81.5%, a difference of 0.020%), Comanche (81.5%, a difference of 0.050%), Mexican (81.6%, a difference of 0.11%), Alaska Native (81.6%, a difference of 0.12%), and Cherokee (81.4%, a difference of 0.13%).
| Demographics | Rating | Rank | In Labor Force | Age 35-44 |
| Hispanics or Latinos | 0.0 /100 | #307 | Tragic 82.1% |
| Immigrants | Central America | 0.0 /100 | #308 | Tragic 82.0% |
| Cree | 0.0 /100 | #309 | Tragic 82.0% |
| Blackfeet | 0.0 /100 | #310 | Tragic 81.9% |
| Colville | 0.0 /100 | #311 | Tragic 81.7% |
| Alaska Natives | 0.0 /100 | #312 | Tragic 81.6% |
| Mexicans | 0.0 /100 | #313 | Tragic 81.6% |
| Cajuns | 0.0 /100 | #314 | Tragic 81.5% |
| Immigrants | Mexico | 0.0 /100 | #315 | Tragic 81.5% |
| Comanche | 0.0 /100 | #316 | Tragic 81.5% |
| Cherokee | 0.0 /100 | #317 | Tragic 81.4% |
| Alaskan Athabascans | 0.0 /100 | #318 | Tragic 81.3% |
| Inupiat | 0.0 /100 | #319 | Tragic 80.9% |
| Chickasaw | 0.0 /100 | #320 | Tragic 80.9% |
| Puerto Ricans | 0.0 /100 | #321 | Tragic 80.7% |