Native/Alaskan vs Salvadoran In Labor Force | Age > 16
COMPARE
Native/Alaskan
Salvadoran
In Labor Force | Age > 16
In Labor Force | Age > 16 Comparison
Natives/Alaskans
Salvadorans
60.6%
IN LABOR FORCE | AGE > 16
0.0/ 100
METRIC RATING
335th/ 347
METRIC RANK
66.8%
IN LABOR FORCE | AGE > 16
100.0/ 100
METRIC RATING
39th/ 347
METRIC RANK
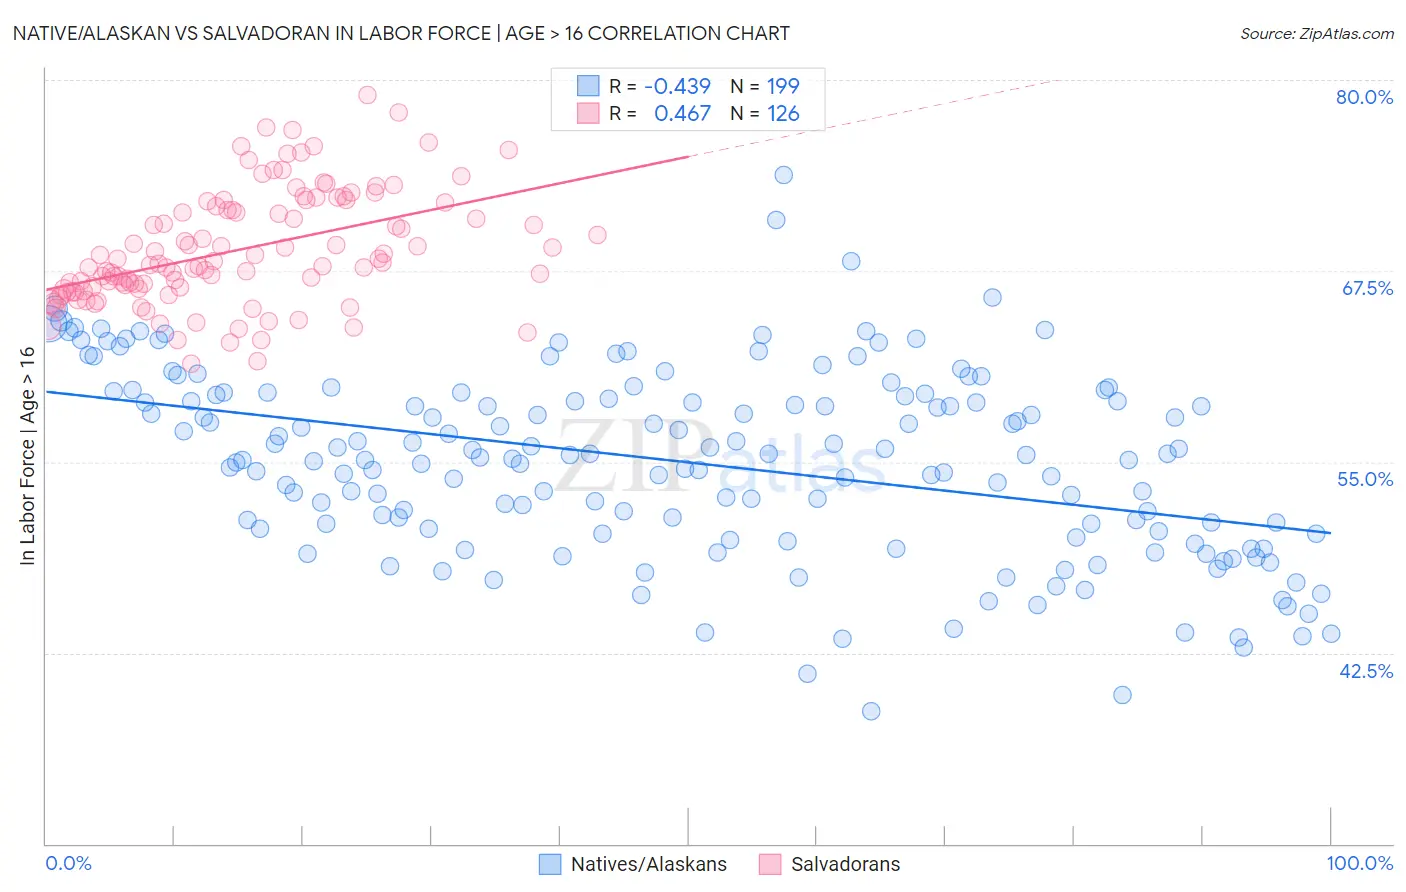
Native/Alaskan vs Salvadoran In Labor Force | Age > 16 Correlation Chart
The statistical analysis conducted on geographies consisting of 513,032,279 people shows a moderate negative correlation between the proportion of Natives/Alaskans and labor force participation rate among population ages 16 and over in the United States with a correlation coefficient (R) of -0.439 and weighted average of 60.6%. Similarly, the statistical analysis conducted on geographies consisting of 399,019,559 people shows a moderate positive correlation between the proportion of Salvadorans and labor force participation rate among population ages 16 and over in the United States with a correlation coefficient (R) of 0.467 and weighted average of 66.8%, a difference of 10.3%.
In Labor Force | Age > 16 Correlation Summary
| Measurement | Native/Alaskan | Salvadoran |
| Minimum | 38.7% | 61.5% |
| Maximum | 73.8% | 79.0% |
| Range | 35.1% | 17.5% |
| Mean | 55.0% | 68.9% |
| Median | 55.3% | 67.9% |
| Interquartile 25% (IQ1) | 50.5% | 66.3% |
| Interquartile 75% (IQ3) | 59.3% | 71.7% |
| Interquartile Range (IQR) | 8.9% | 5.4% |
| Standard Deviation (Sample) | 6.1% | 3.7% |
| Standard Deviation (Population) | 6.1% | 3.7% |
Similar Demographics by In Labor Force | Age > 16
Demographics Similar to Natives/Alaskans by In Labor Force | Age > 16
In terms of in labor force | age > 16, the demographic groups most similar to Natives/Alaskans are Menominee (60.6%, a difference of 0.020%), Apache (60.7%, a difference of 0.19%), Paiute (60.7%, a difference of 0.23%), Crow (60.8%, a difference of 0.31%), and Ute (60.9%, a difference of 0.49%).
| Demographics | Rating | Rank | In Labor Force | Age > 16 |
| Dutch West Indians | 0.0 /100 | #328 | Tragic 61.7% |
| Choctaw | 0.0 /100 | #329 | Tragic 61.5% |
| Creek | 0.0 /100 | #330 | Tragic 61.3% |
| Ute | 0.0 /100 | #331 | Tragic 60.9% |
| Crow | 0.0 /100 | #332 | Tragic 60.8% |
| Paiute | 0.0 /100 | #333 | Tragic 60.7% |
| Apache | 0.0 /100 | #334 | Tragic 60.7% |
| Natives/Alaskans | 0.0 /100 | #335 | Tragic 60.6% |
| Menominee | 0.0 /100 | #336 | Tragic 60.6% |
| Colville | 0.0 /100 | #337 | Tragic 59.8% |
| Immigrants | Yemen | 0.0 /100 | #338 | Tragic 59.6% |
| Houma | 0.0 /100 | #339 | Tragic 59.5% |
| Pueblo | 0.0 /100 | #340 | Tragic 59.3% |
| Hopi | 0.0 /100 | #341 | Tragic 58.4% |
| Puerto Ricans | 0.0 /100 | #342 | Tragic 58.1% |
Demographics Similar to Salvadorans by In Labor Force | Age > 16
In terms of in labor force | age > 16, the demographic groups most similar to Salvadorans are Immigrants from El Salvador (66.8%, a difference of 0.020%), Immigrants from Zimbabwe (66.8%, a difference of 0.020%), Senegalese (66.7%, a difference of 0.11%), Luxembourger (66.7%, a difference of 0.14%), and Immigrants from Nigeria (66.9%, a difference of 0.16%).
| Demographics | Rating | Rank | In Labor Force | Age > 16 |
| Immigrants | Congo | 100.0 /100 | #32 | Exceptional 67.1% |
| Afghans | 100.0 /100 | #33 | Exceptional 67.1% |
| Immigrants | Ghana | 100.0 /100 | #34 | Exceptional 67.1% |
| Immigrants | South Central Asia | 100.0 /100 | #35 | Exceptional 67.1% |
| Immigrants | Western Africa | 100.0 /100 | #36 | Exceptional 67.1% |
| Immigrants | Afghanistan | 100.0 /100 | #37 | Exceptional 67.0% |
| Immigrants | Nigeria | 100.0 /100 | #38 | Exceptional 66.9% |
| Salvadorans | 100.0 /100 | #39 | Exceptional 66.8% |
| Immigrants | El Salvador | 100.0 /100 | #40 | Exceptional 66.8% |
| Immigrants | Zimbabwe | 100.0 /100 | #41 | Exceptional 66.8% |
| Senegalese | 100.0 /100 | #42 | Exceptional 66.7% |
| Luxembourgers | 100.0 /100 | #43 | Exceptional 66.7% |
| Immigrants | Pakistan | 100.0 /100 | #44 | Exceptional 66.7% |
| Immigrants | Brazil | 100.0 /100 | #45 | Exceptional 66.7% |
| Brazilians | 100.0 /100 | #46 | Exceptional 66.6% |