Native/Alaskan vs Immigrants from Switzerland In Labor Force | Age 20-64
COMPARE
Native/Alaskan
Immigrants from Switzerland
In Labor Force | Age 20-64
In Labor Force | Age 20-64 Comparison
Natives/Alaskans
Immigrants from Switzerland
73.9%
IN LABOR FORCE | AGE 20-64
0.0/ 100
METRIC RATING
333rd/ 347
METRIC RANK
79.6%
IN LABOR FORCE | AGE 20-64
53.3/ 100
METRIC RATING
171st/ 347
METRIC RANK
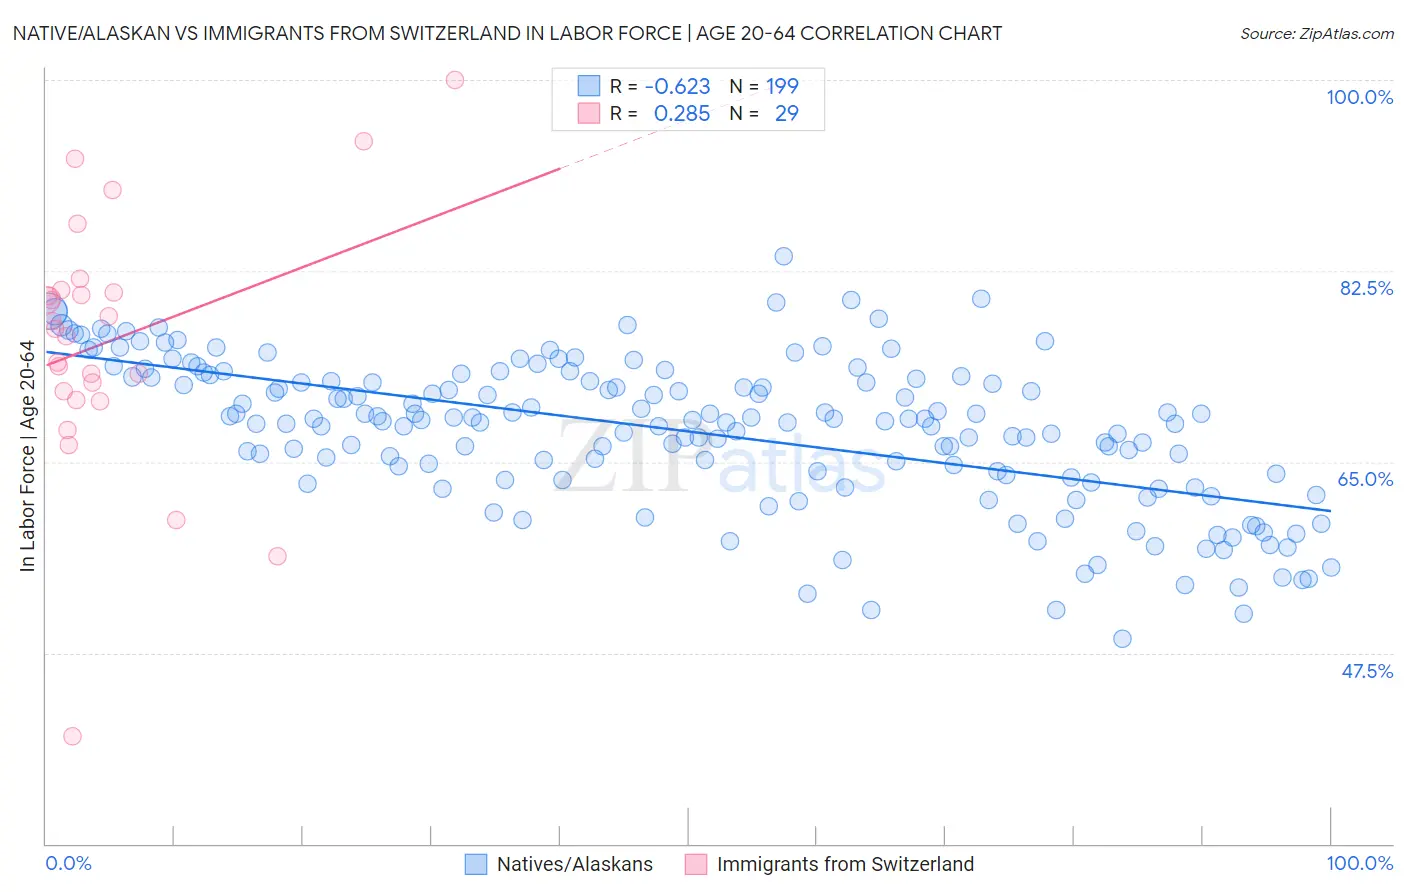
Native/Alaskan vs Immigrants from Switzerland In Labor Force | Age 20-64 Correlation Chart
The statistical analysis conducted on geographies consisting of 513,028,645 people shows a significant negative correlation between the proportion of Natives/Alaskans and labor force participation rate among population between the ages 20 and 64 in the United States with a correlation coefficient (R) of -0.623 and weighted average of 73.9%. Similarly, the statistical analysis conducted on geographies consisting of 148,083,469 people shows a weak positive correlation between the proportion of Immigrants from Switzerland and labor force participation rate among population between the ages 20 and 64 in the United States with a correlation coefficient (R) of 0.285 and weighted average of 79.6%, a difference of 7.7%.
In Labor Force | Age 20-64 Correlation Summary
| Measurement | Native/Alaskan | Immigrants from Switzerland |
| Minimum | 48.8% | 39.8% |
| Maximum | 83.9% | 100.0% |
| Range | 35.1% | 60.2% |
| Mean | 67.8% | 76.1% |
| Median | 68.8% | 77.2% |
| Interquartile 25% (IQ1) | 63.6% | 71.1% |
| Interquartile 75% (IQ3) | 72.7% | 80.6% |
| Interquartile Range (IQR) | 9.2% | 9.6% |
| Standard Deviation (Sample) | 6.8% | 11.8% |
| Standard Deviation (Population) | 6.8% | 11.6% |
Similar Demographics by In Labor Force | Age 20-64
Demographics Similar to Natives/Alaskans by In Labor Force | Age 20-64
In terms of in labor force | age 20-64, the demographic groups most similar to Natives/Alaskans are Apache (73.7%, a difference of 0.30%), Ute (73.7%, a difference of 0.32%), Arapaho (74.4%, a difference of 0.66%), Crow (73.3%, a difference of 0.83%), and Yup'ik (73.2%, a difference of 0.95%).
| Demographics | Rating | Rank | In Labor Force | Age 20-64 |
| Creek | 0.0 /100 | #326 | Tragic 75.1% |
| Sioux | 0.0 /100 | #327 | Tragic 75.0% |
| Kiowa | 0.0 /100 | #328 | Tragic 75.0% |
| Cheyenne | 0.0 /100 | #329 | Tragic 74.8% |
| Colville | 0.0 /100 | #330 | Tragic 74.8% |
| Paiute | 0.0 /100 | #331 | Tragic 74.7% |
| Arapaho | 0.0 /100 | #332 | Tragic 74.4% |
| Natives/Alaskans | 0.0 /100 | #333 | Tragic 73.9% |
| Apache | 0.0 /100 | #334 | Tragic 73.7% |
| Ute | 0.0 /100 | #335 | Tragic 73.7% |
| Crow | 0.0 /100 | #336 | Tragic 73.3% |
| Yup'ik | 0.0 /100 | #337 | Tragic 73.2% |
| Puerto Ricans | 0.0 /100 | #338 | Tragic 73.1% |
| Houma | 0.0 /100 | #339 | Tragic 72.7% |
| Pueblo | 0.0 /100 | #340 | Tragic 72.6% |
Demographics Similar to Immigrants from Switzerland by In Labor Force | Age 20-64
In terms of in labor force | age 20-64, the demographic groups most similar to Immigrants from Switzerland are Immigrants from Belgium (79.6%, a difference of 0.0%), Slavic (79.6%, a difference of 0.010%), Immigrants from Scotland (79.6%, a difference of 0.010%), Syrian (79.6%, a difference of 0.030%), and Laotian (79.6%, a difference of 0.040%).
| Demographics | Rating | Rank | In Labor Force | Age 20-64 |
| Immigrants | Burma/Myanmar | 64.4 /100 | #164 | Good 79.7% |
| Nigerians | 64.0 /100 | #165 | Good 79.7% |
| Okinawans | 62.7 /100 | #166 | Good 79.6% |
| Immigrants | Iraq | 62.0 /100 | #167 | Good 79.6% |
| Immigrants | Indonesia | 61.8 /100 | #168 | Good 79.6% |
| Laotians | 58.4 /100 | #169 | Average 79.6% |
| Slavs | 54.0 /100 | #170 | Average 79.6% |
| Immigrants | Switzerland | 53.3 /100 | #171 | Average 79.6% |
| Immigrants | Belgium | 53.1 /100 | #172 | Average 79.6% |
| Immigrants | Scotland | 52.4 /100 | #173 | Average 79.6% |
| Syrians | 50.0 /100 | #174 | Average 79.6% |
| Cubans | 46.1 /100 | #175 | Average 79.5% |
| Australians | 46.0 /100 | #176 | Average 79.5% |
| Immigrants | Netherlands | 45.2 /100 | #177 | Average 79.5% |
| Czechoslovakians | 44.3 /100 | #178 | Average 79.5% |