Immigrants from Portugal vs Immigrants from Switzerland In Labor Force | Age 20-64
COMPARE
Immigrants from Portugal
Immigrants from Switzerland
In Labor Force | Age 20-64
In Labor Force | Age 20-64 Comparison
Immigrants from Portugal
Immigrants from Switzerland
79.3%
IN LABOR FORCE | AGE 20-64
12.8/ 100
METRIC RATING
213th/ 347
METRIC RANK
79.6%
IN LABOR FORCE | AGE 20-64
53.3/ 100
METRIC RATING
171st/ 347
METRIC RANK
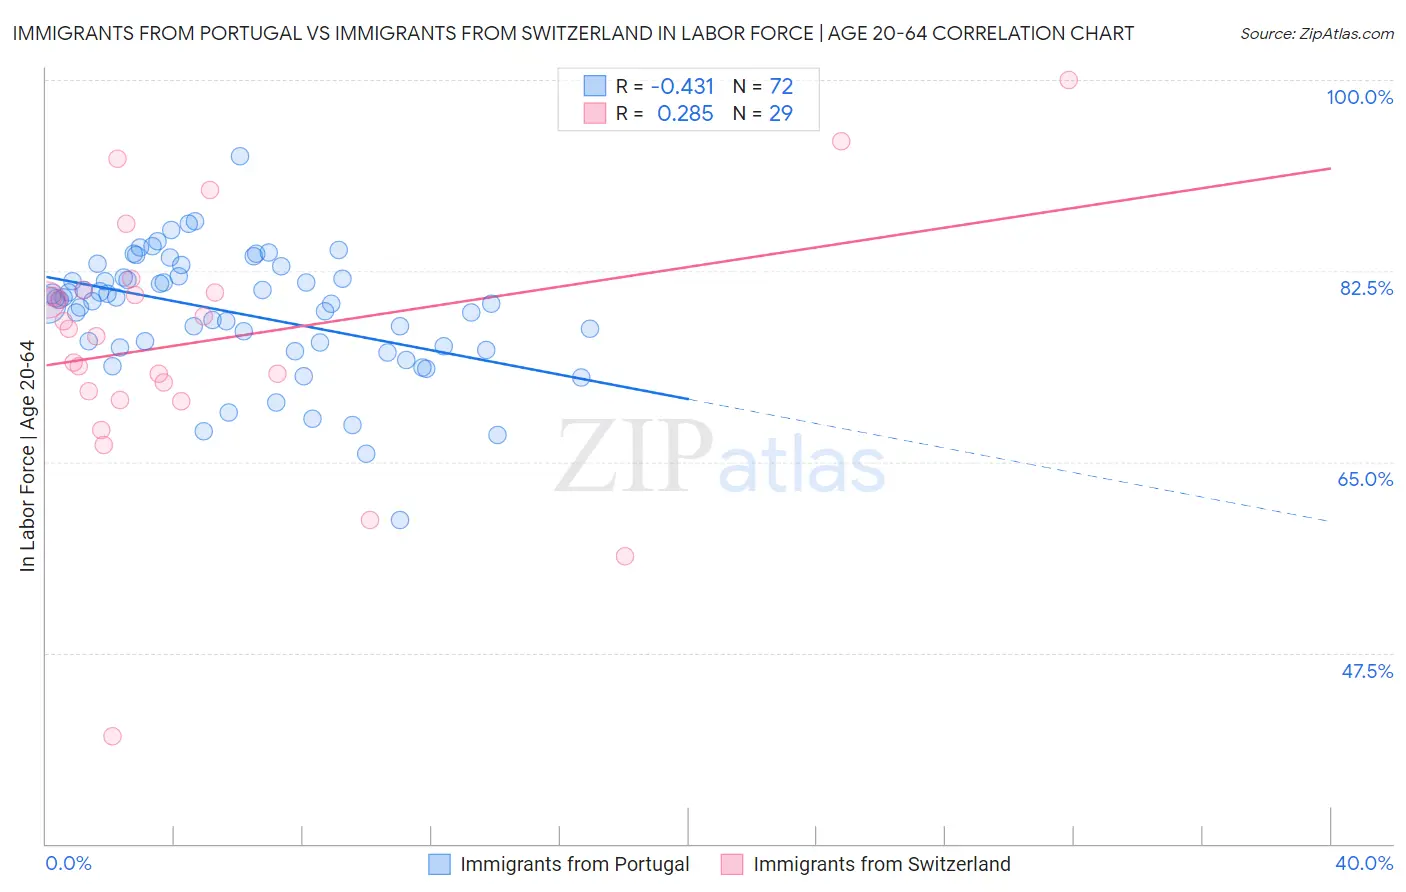
Immigrants from Portugal vs Immigrants from Switzerland In Labor Force | Age 20-64 Correlation Chart
The statistical analysis conducted on geographies consisting of 174,779,205 people shows a moderate negative correlation between the proportion of Immigrants from Portugal and labor force participation rate among population between the ages 20 and 64 in the United States with a correlation coefficient (R) of -0.431 and weighted average of 79.3%. Similarly, the statistical analysis conducted on geographies consisting of 148,083,469 people shows a weak positive correlation between the proportion of Immigrants from Switzerland and labor force participation rate among population between the ages 20 and 64 in the United States with a correlation coefficient (R) of 0.285 and weighted average of 79.6%, a difference of 0.41%.
In Labor Force | Age 20-64 Correlation Summary
| Measurement | Immigrants from Portugal | Immigrants from Switzerland |
| Minimum | 59.7% | 39.8% |
| Maximum | 93.0% | 100.0% |
| Range | 33.3% | 60.2% |
| Mean | 78.7% | 76.1% |
| Median | 79.7% | 77.2% |
| Interquartile 25% (IQ1) | 75.5% | 71.1% |
| Interquartile 75% (IQ3) | 82.0% | 80.6% |
| Interquartile Range (IQR) | 6.4% | 9.6% |
| Standard Deviation (Sample) | 5.6% | 11.8% |
| Standard Deviation (Population) | 5.6% | 11.6% |
Similar Demographics by In Labor Force | Age 20-64
Demographics Similar to Immigrants from Portugal by In Labor Force | Age 20-64
In terms of in labor force | age 20-64, the demographic groups most similar to Immigrants from Portugal are Irish (79.3%, a difference of 0.010%), Immigrants from Armenia (79.2%, a difference of 0.010%), Immigrants from Norway (79.2%, a difference of 0.020%), Arab (79.2%, a difference of 0.030%), and Immigrants from Western Asia (79.2%, a difference of 0.030%).
| Demographics | Rating | Rank | In Labor Force | Age 20-64 |
| Immigrants | Ecuador | 16.9 /100 | #206 | Poor 79.3% |
| Sub-Saharan Africans | 16.5 /100 | #207 | Poor 79.3% |
| British | 16.5 /100 | #208 | Poor 79.3% |
| Bangladeshis | 16.4 /100 | #209 | Poor 79.3% |
| Haitians | 16.1 /100 | #210 | Poor 79.3% |
| Europeans | 15.3 /100 | #211 | Poor 79.3% |
| Irish | 13.2 /100 | #212 | Poor 79.3% |
| Immigrants | Portugal | 12.8 /100 | #213 | Poor 79.3% |
| Immigrants | Armenia | 12.2 /100 | #214 | Poor 79.2% |
| Immigrants | Norway | 12.0 /100 | #215 | Poor 79.2% |
| Arabs | 11.4 /100 | #216 | Poor 79.2% |
| Immigrants | Western Asia | 11.0 /100 | #217 | Poor 79.2% |
| Immigrants | England | 9.3 /100 | #218 | Tragic 79.2% |
| French Canadians | 8.4 /100 | #219 | Tragic 79.2% |
| Immigrants | Immigrants | 7.7 /100 | #220 | Tragic 79.2% |
Demographics Similar to Immigrants from Switzerland by In Labor Force | Age 20-64
In terms of in labor force | age 20-64, the demographic groups most similar to Immigrants from Switzerland are Immigrants from Belgium (79.6%, a difference of 0.0%), Slavic (79.6%, a difference of 0.010%), Immigrants from Scotland (79.6%, a difference of 0.010%), Syrian (79.6%, a difference of 0.030%), and Laotian (79.6%, a difference of 0.040%).
| Demographics | Rating | Rank | In Labor Force | Age 20-64 |
| Immigrants | Burma/Myanmar | 64.4 /100 | #164 | Good 79.7% |
| Nigerians | 64.0 /100 | #165 | Good 79.7% |
| Okinawans | 62.7 /100 | #166 | Good 79.6% |
| Immigrants | Iraq | 62.0 /100 | #167 | Good 79.6% |
| Immigrants | Indonesia | 61.8 /100 | #168 | Good 79.6% |
| Laotians | 58.4 /100 | #169 | Average 79.6% |
| Slavs | 54.0 /100 | #170 | Average 79.6% |
| Immigrants | Switzerland | 53.3 /100 | #171 | Average 79.6% |
| Immigrants | Belgium | 53.1 /100 | #172 | Average 79.6% |
| Immigrants | Scotland | 52.4 /100 | #173 | Average 79.6% |
| Syrians | 50.0 /100 | #174 | Average 79.6% |
| Cubans | 46.1 /100 | #175 | Average 79.5% |
| Australians | 46.0 /100 | #176 | Average 79.5% |
| Immigrants | Netherlands | 45.2 /100 | #177 | Average 79.5% |
| Czechoslovakians | 44.3 /100 | #178 | Average 79.5% |