Native/Alaskan vs Immigrants from Switzerland 2nd Grade
COMPARE
Native/Alaskan
Immigrants from Switzerland
2nd Grade
2nd Grade Comparison
Natives/Alaskans
Immigrants from Switzerland
97.9%
2ND GRADE
44.3/ 100
METRIC RATING
180th/ 347
METRIC RANK
98.1%
2ND GRADE
97.3/ 100
METRIC RATING
108th/ 347
METRIC RANK
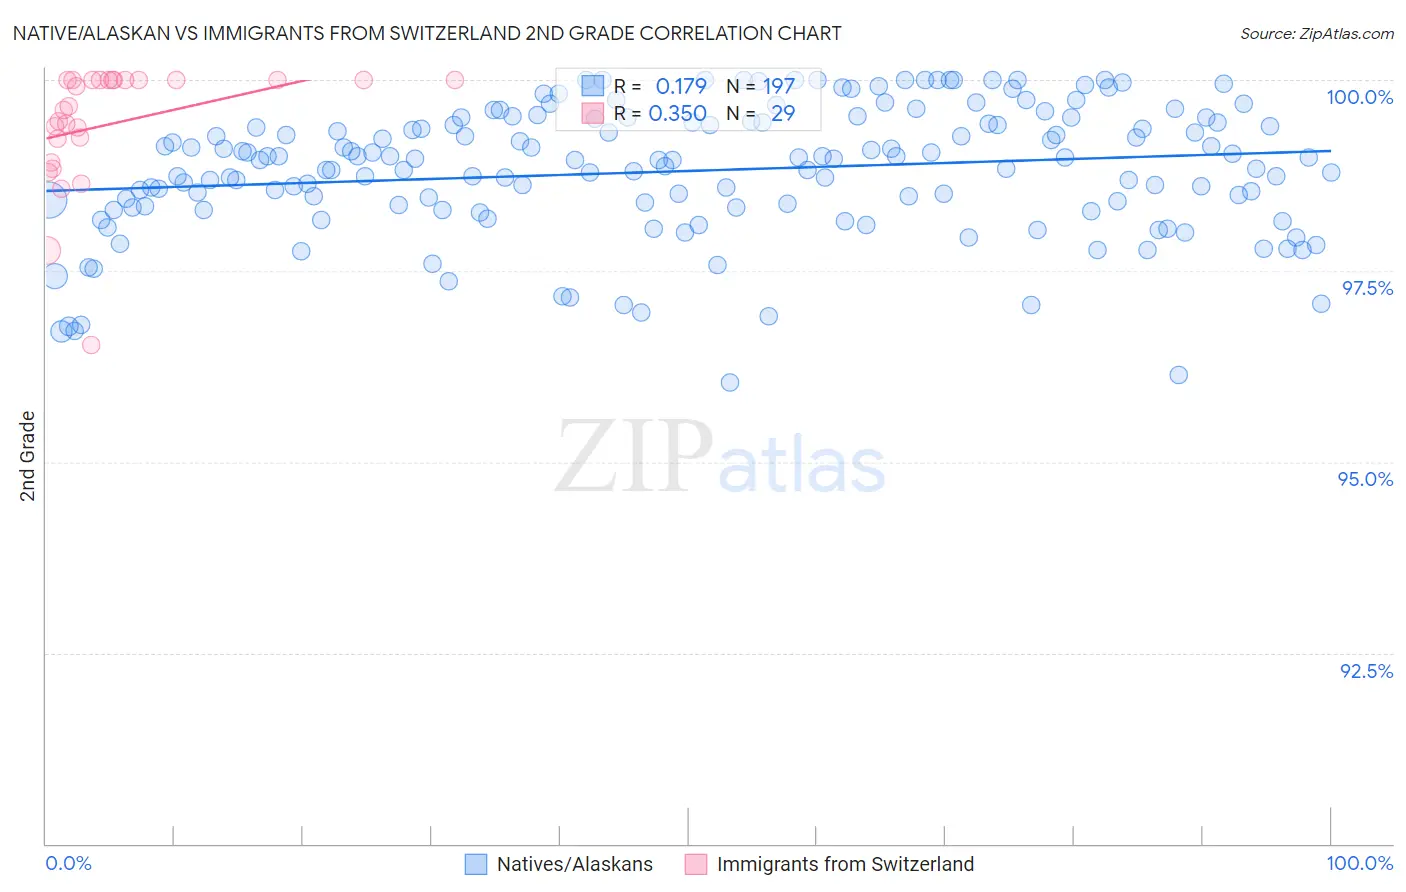
Native/Alaskan vs Immigrants from Switzerland 2nd Grade Correlation Chart
The statistical analysis conducted on geographies consisting of 513,058,987 people shows a poor positive correlation between the proportion of Natives/Alaskans and percentage of population with at least 2nd grade education in the United States with a correlation coefficient (R) of 0.179 and weighted average of 97.9%. Similarly, the statistical analysis conducted on geographies consisting of 148,082,451 people shows a mild positive correlation between the proportion of Immigrants from Switzerland and percentage of population with at least 2nd grade education in the United States with a correlation coefficient (R) of 0.350 and weighted average of 98.1%, a difference of 0.30%.
2nd Grade Correlation Summary
| Measurement | Native/Alaskan | Immigrants from Switzerland |
| Minimum | 96.0% | 96.5% |
| Maximum | 100.0% | 100.0% |
| Range | 4.0% | 3.5% |
| Mean | 98.8% | 99.4% |
| Median | 99.0% | 99.7% |
| Interquartile 25% (IQ1) | 98.3% | 99.1% |
| Interquartile 75% (IQ3) | 99.4% | 100.0% |
| Interquartile Range (IQR) | 1.1% | 0.93% |
| Standard Deviation (Sample) | 0.85% | 0.80% |
| Standard Deviation (Population) | 0.85% | 0.79% |
Similar Demographics by 2nd Grade
Demographics Similar to Natives/Alaskans by 2nd Grade
In terms of 2nd grade, the demographic groups most similar to Natives/Alaskans are Egyptian (97.9%, a difference of 0.0%), Immigrants from Sri Lanka (97.9%, a difference of 0.010%), Immigrants from Brazil (97.9%, a difference of 0.010%), Argentinean (97.9%, a difference of 0.010%), and Immigrants from Venezuela (97.9%, a difference of 0.010%).
| Demographics | Rating | Rank | 2nd Grade |
| Kenyans | 52.7 /100 | #173 | Average 97.9% |
| Immigrants | Micronesia | 50.0 /100 | #174 | Average 97.9% |
| Immigrants | Bosnia and Herzegovina | 49.8 /100 | #175 | Average 97.9% |
| Immigrants | Sri Lanka | 48.7 /100 | #176 | Average 97.9% |
| Immigrants | Brazil | 46.6 /100 | #177 | Average 97.9% |
| Argentineans | 46.3 /100 | #178 | Average 97.9% |
| Immigrants | Venezuela | 46.1 /100 | #179 | Average 97.9% |
| Natives/Alaskans | 44.3 /100 | #180 | Average 97.9% |
| Egyptians | 44.3 /100 | #181 | Average 97.9% |
| Portuguese | 42.4 /100 | #182 | Average 97.8% |
| Immigrants | Poland | 42.2 /100 | #183 | Average 97.8% |
| Immigrants | Belarus | 41.5 /100 | #184 | Average 97.8% |
| Immigrants | Argentina | 40.6 /100 | #185 | Average 97.8% |
| Arabs | 36.9 /100 | #186 | Fair 97.8% |
| Pakistanis | 36.1 /100 | #187 | Fair 97.8% |
Demographics Similar to Immigrants from Switzerland by 2nd Grade
In terms of 2nd grade, the demographic groups most similar to Immigrants from Switzerland are Bhutanese (98.1%, a difference of 0.0%), German Russian (98.1%, a difference of 0.0%), Basque (98.1%, a difference of 0.0%), Pima (98.2%, a difference of 0.010%), and Turkish (98.2%, a difference of 0.010%).
| Demographics | Rating | Rank | 2nd Grade |
| Puget Sound Salish | 98.0 /100 | #101 | Exceptional 98.2% |
| Cree | 98.0 /100 | #102 | Exceptional 98.2% |
| Pima | 97.6 /100 | #103 | Exceptional 98.2% |
| Turks | 97.6 /100 | #104 | Exceptional 98.2% |
| Yugoslavians | 97.5 /100 | #105 | Exceptional 98.2% |
| Bhutanese | 97.5 /100 | #106 | Exceptional 98.1% |
| German Russians | 97.4 /100 | #107 | Exceptional 98.1% |
| Immigrants | Switzerland | 97.3 /100 | #108 | Exceptional 98.1% |
| Basques | 97.2 /100 | #109 | Exceptional 98.1% |
| Immigrants | Singapore | 97.0 /100 | #110 | Exceptional 98.1% |
| Immigrants | Czechoslovakia | 96.9 /100 | #111 | Exceptional 98.1% |
| Colville | 96.6 /100 | #112 | Exceptional 98.1% |
| Immigrants | Norway | 96.5 /100 | #113 | Exceptional 98.1% |
| Immigrants | Latvia | 96.4 /100 | #114 | Exceptional 98.1% |
| Iranians | 95.9 /100 | #115 | Exceptional 98.1% |