Native/Alaskan vs Immigrants from Armenia In Labor Force | Age 20-64
COMPARE
Native/Alaskan
Immigrants from Armenia
In Labor Force | Age 20-64
In Labor Force | Age 20-64 Comparison
Natives/Alaskans
Immigrants from Armenia
73.9%
IN LABOR FORCE | AGE 20-64
0.0/ 100
METRIC RATING
333rd/ 347
METRIC RANK
79.2%
IN LABOR FORCE | AGE 20-64
12.2/ 100
METRIC RATING
214th/ 347
METRIC RANK
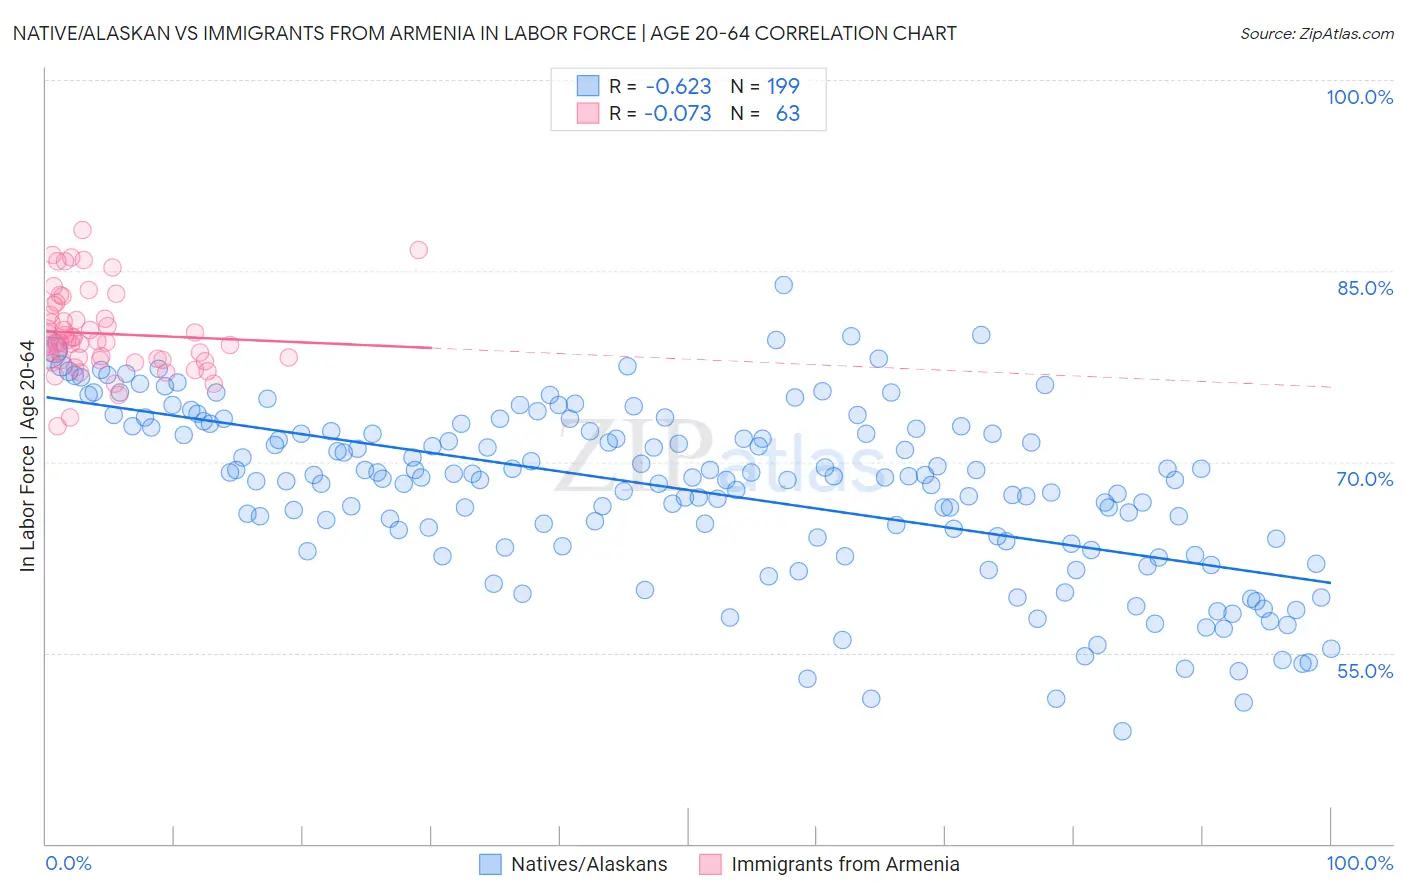
Native/Alaskan vs Immigrants from Armenia In Labor Force | Age 20-64 Correlation Chart
The statistical analysis conducted on geographies consisting of 513,028,645 people shows a significant negative correlation between the proportion of Natives/Alaskans and labor force participation rate among population between the ages 20 and 64 in the United States with a correlation coefficient (R) of -0.623 and weighted average of 73.9%. Similarly, the statistical analysis conducted on geographies consisting of 97,718,343 people shows a slight negative correlation between the proportion of Immigrants from Armenia and labor force participation rate among population between the ages 20 and 64 in the United States with a correlation coefficient (R) of -0.073 and weighted average of 79.2%, a difference of 7.2%.
In Labor Force | Age 20-64 Correlation Summary
| Measurement | Native/Alaskan | Immigrants from Armenia |
| Minimum | 48.8% | 72.8% |
| Maximum | 83.9% | 88.2% |
| Range | 35.1% | 15.4% |
| Mean | 67.8% | 80.1% |
| Median | 68.8% | 79.5% |
| Interquartile 25% (IQ1) | 63.6% | 78.0% |
| Interquartile 75% (IQ3) | 72.7% | 81.5% |
| Interquartile Range (IQR) | 9.2% | 3.5% |
| Standard Deviation (Sample) | 6.8% | 3.2% |
| Standard Deviation (Population) | 6.8% | 3.2% |
Similar Demographics by In Labor Force | Age 20-64
Demographics Similar to Natives/Alaskans by In Labor Force | Age 20-64
In terms of in labor force | age 20-64, the demographic groups most similar to Natives/Alaskans are Apache (73.7%, a difference of 0.30%), Ute (73.7%, a difference of 0.32%), Arapaho (74.4%, a difference of 0.66%), Crow (73.3%, a difference of 0.83%), and Yup'ik (73.2%, a difference of 0.95%).
| Demographics | Rating | Rank | In Labor Force | Age 20-64 |
| Creek | 0.0 /100 | #326 | Tragic 75.1% |
| Sioux | 0.0 /100 | #327 | Tragic 75.0% |
| Kiowa | 0.0 /100 | #328 | Tragic 75.0% |
| Cheyenne | 0.0 /100 | #329 | Tragic 74.8% |
| Colville | 0.0 /100 | #330 | Tragic 74.8% |
| Paiute | 0.0 /100 | #331 | Tragic 74.7% |
| Arapaho | 0.0 /100 | #332 | Tragic 74.4% |
| Natives/Alaskans | 0.0 /100 | #333 | Tragic 73.9% |
| Apache | 0.0 /100 | #334 | Tragic 73.7% |
| Ute | 0.0 /100 | #335 | Tragic 73.7% |
| Crow | 0.0 /100 | #336 | Tragic 73.3% |
| Yup'ik | 0.0 /100 | #337 | Tragic 73.2% |
| Puerto Ricans | 0.0 /100 | #338 | Tragic 73.1% |
| Houma | 0.0 /100 | #339 | Tragic 72.7% |
| Pueblo | 0.0 /100 | #340 | Tragic 72.6% |
Demographics Similar to Immigrants from Armenia by In Labor Force | Age 20-64
In terms of in labor force | age 20-64, the demographic groups most similar to Immigrants from Armenia are Immigrants from Norway (79.2%, a difference of 0.0%), Immigrants from Portugal (79.3%, a difference of 0.010%), Arab (79.2%, a difference of 0.010%), Irish (79.3%, a difference of 0.020%), and Immigrants from Western Asia (79.2%, a difference of 0.020%).
| Demographics | Rating | Rank | In Labor Force | Age 20-64 |
| Sub-Saharan Africans | 16.5 /100 | #207 | Poor 79.3% |
| British | 16.5 /100 | #208 | Poor 79.3% |
| Bangladeshis | 16.4 /100 | #209 | Poor 79.3% |
| Haitians | 16.1 /100 | #210 | Poor 79.3% |
| Europeans | 15.3 /100 | #211 | Poor 79.3% |
| Irish | 13.2 /100 | #212 | Poor 79.3% |
| Immigrants | Portugal | 12.8 /100 | #213 | Poor 79.3% |
| Immigrants | Armenia | 12.2 /100 | #214 | Poor 79.2% |
| Immigrants | Norway | 12.0 /100 | #215 | Poor 79.2% |
| Arabs | 11.4 /100 | #216 | Poor 79.2% |
| Immigrants | Western Asia | 11.0 /100 | #217 | Poor 79.2% |
| Immigrants | England | 9.3 /100 | #218 | Tragic 79.2% |
| French Canadians | 8.4 /100 | #219 | Tragic 79.2% |
| Immigrants | Immigrants | 7.7 /100 | #220 | Tragic 79.2% |
| Hungarians | 7.2 /100 | #221 | Tragic 79.2% |