Native/Alaskan vs Salvadoran In Labor Force | Age 20-64
COMPARE
Native/Alaskan
Salvadoran
In Labor Force | Age 20-64
In Labor Force | Age 20-64 Comparison
Natives/Alaskans
Salvadorans
73.9%
IN LABOR FORCE | AGE 20-64
0.0/ 100
METRIC RATING
333rd/ 347
METRIC RANK
79.5%
IN LABOR FORCE | AGE 20-64
41.0/ 100
METRIC RATING
180th/ 347
METRIC RANK
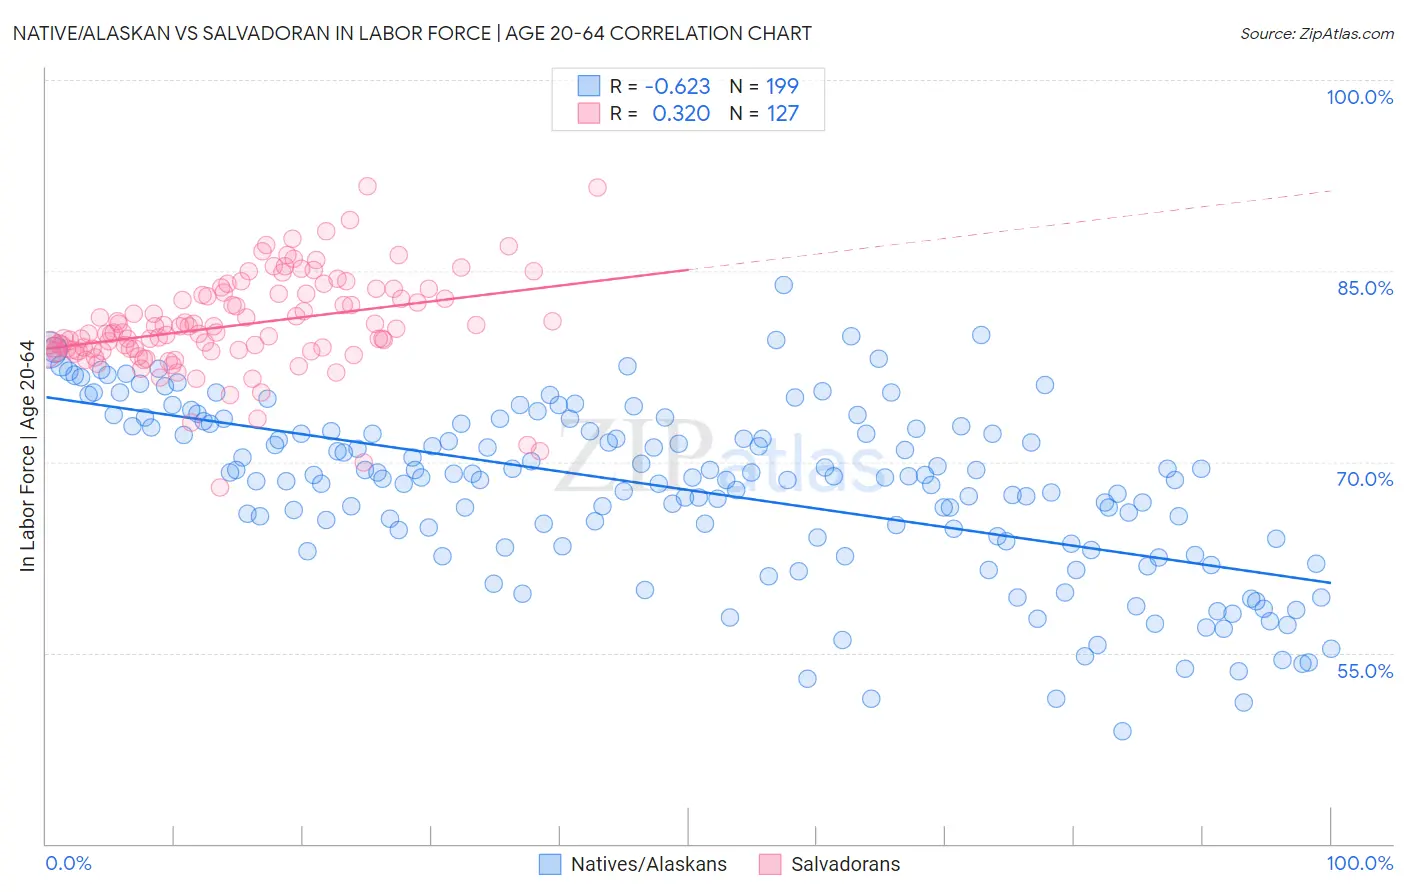
Native/Alaskan vs Salvadoran In Labor Force | Age 20-64 Correlation Chart
The statistical analysis conducted on geographies consisting of 513,028,645 people shows a significant negative correlation between the proportion of Natives/Alaskans and labor force participation rate among population between the ages 20 and 64 in the United States with a correlation coefficient (R) of -0.623 and weighted average of 73.9%. Similarly, the statistical analysis conducted on geographies consisting of 399,020,131 people shows a mild positive correlation between the proportion of Salvadorans and labor force participation rate among population between the ages 20 and 64 in the United States with a correlation coefficient (R) of 0.320 and weighted average of 79.5%, a difference of 7.6%.
In Labor Force | Age 20-64 Correlation Summary
| Measurement | Native/Alaskan | Salvadoran |
| Minimum | 48.8% | 68.0% |
| Maximum | 83.9% | 91.7% |
| Range | 35.1% | 23.7% |
| Mean | 67.8% | 80.7% |
| Median | 68.8% | 80.1% |
| Interquartile 25% (IQ1) | 63.6% | 78.7% |
| Interquartile 75% (IQ3) | 72.7% | 83.2% |
| Interquartile Range (IQR) | 9.2% | 4.5% |
| Standard Deviation (Sample) | 6.8% | 3.8% |
| Standard Deviation (Population) | 6.8% | 3.8% |
Similar Demographics by In Labor Force | Age 20-64
Demographics Similar to Natives/Alaskans by In Labor Force | Age 20-64
In terms of in labor force | age 20-64, the demographic groups most similar to Natives/Alaskans are Apache (73.7%, a difference of 0.30%), Ute (73.7%, a difference of 0.32%), Arapaho (74.4%, a difference of 0.66%), Crow (73.3%, a difference of 0.83%), and Yup'ik (73.2%, a difference of 0.95%).
| Demographics | Rating | Rank | In Labor Force | Age 20-64 |
| Creek | 0.0 /100 | #326 | Tragic 75.1% |
| Sioux | 0.0 /100 | #327 | Tragic 75.0% |
| Kiowa | 0.0 /100 | #328 | Tragic 75.0% |
| Cheyenne | 0.0 /100 | #329 | Tragic 74.8% |
| Colville | 0.0 /100 | #330 | Tragic 74.8% |
| Paiute | 0.0 /100 | #331 | Tragic 74.7% |
| Arapaho | 0.0 /100 | #332 | Tragic 74.4% |
| Natives/Alaskans | 0.0 /100 | #333 | Tragic 73.9% |
| Apache | 0.0 /100 | #334 | Tragic 73.7% |
| Ute | 0.0 /100 | #335 | Tragic 73.7% |
| Crow | 0.0 /100 | #336 | Tragic 73.3% |
| Yup'ik | 0.0 /100 | #337 | Tragic 73.2% |
| Puerto Ricans | 0.0 /100 | #338 | Tragic 73.1% |
| Houma | 0.0 /100 | #339 | Tragic 72.7% |
| Pueblo | 0.0 /100 | #340 | Tragic 72.6% |
Demographics Similar to Salvadorans by In Labor Force | Age 20-64
In terms of in labor force | age 20-64, the demographic groups most similar to Salvadorans are Armenian (79.5%, a difference of 0.0%), Immigrants from Netherlands (79.5%, a difference of 0.030%), Czechoslovakian (79.5%, a difference of 0.030%), Immigrants from Saudi Arabia (79.5%, a difference of 0.030%), and Malaysian (79.5%, a difference of 0.030%).
| Demographics | Rating | Rank | In Labor Force | Age 20-64 |
| Immigrants | Scotland | 52.4 /100 | #173 | Average 79.6% |
| Syrians | 50.0 /100 | #174 | Average 79.6% |
| Cubans | 46.1 /100 | #175 | Average 79.5% |
| Australians | 46.0 /100 | #176 | Average 79.5% |
| Immigrants | Netherlands | 45.2 /100 | #177 | Average 79.5% |
| Czechoslovakians | 44.3 /100 | #178 | Average 79.5% |
| Armenians | 41.4 /100 | #179 | Average 79.5% |
| Salvadorans | 41.0 /100 | #180 | Average 79.5% |
| Immigrants | Saudi Arabia | 37.7 /100 | #181 | Fair 79.5% |
| Malaysians | 37.1 /100 | #182 | Fair 79.5% |
| Immigrants | Hungary | 36.8 /100 | #183 | Fair 79.5% |
| Finns | 35.9 /100 | #184 | Fair 79.5% |
| Israelis | 34.7 /100 | #185 | Fair 79.5% |
| Northern Europeans | 34.5 /100 | #186 | Fair 79.5% |
| Assyrians/Chaldeans/Syriacs | 33.3 /100 | #187 | Fair 79.4% |