Immigrants from Eritrea vs Immigrants from Switzerland In Labor Force | Age 20-64
COMPARE
Immigrants from Eritrea
Immigrants from Switzerland
In Labor Force | Age 20-64
In Labor Force | Age 20-64 Comparison
Immigrants from Eritrea
Immigrants from Switzerland
81.3%
IN LABOR FORCE | AGE 20-64
100.0/ 100
METRIC RATING
12th/ 347
METRIC RANK
79.6%
IN LABOR FORCE | AGE 20-64
53.3/ 100
METRIC RATING
171st/ 347
METRIC RANK
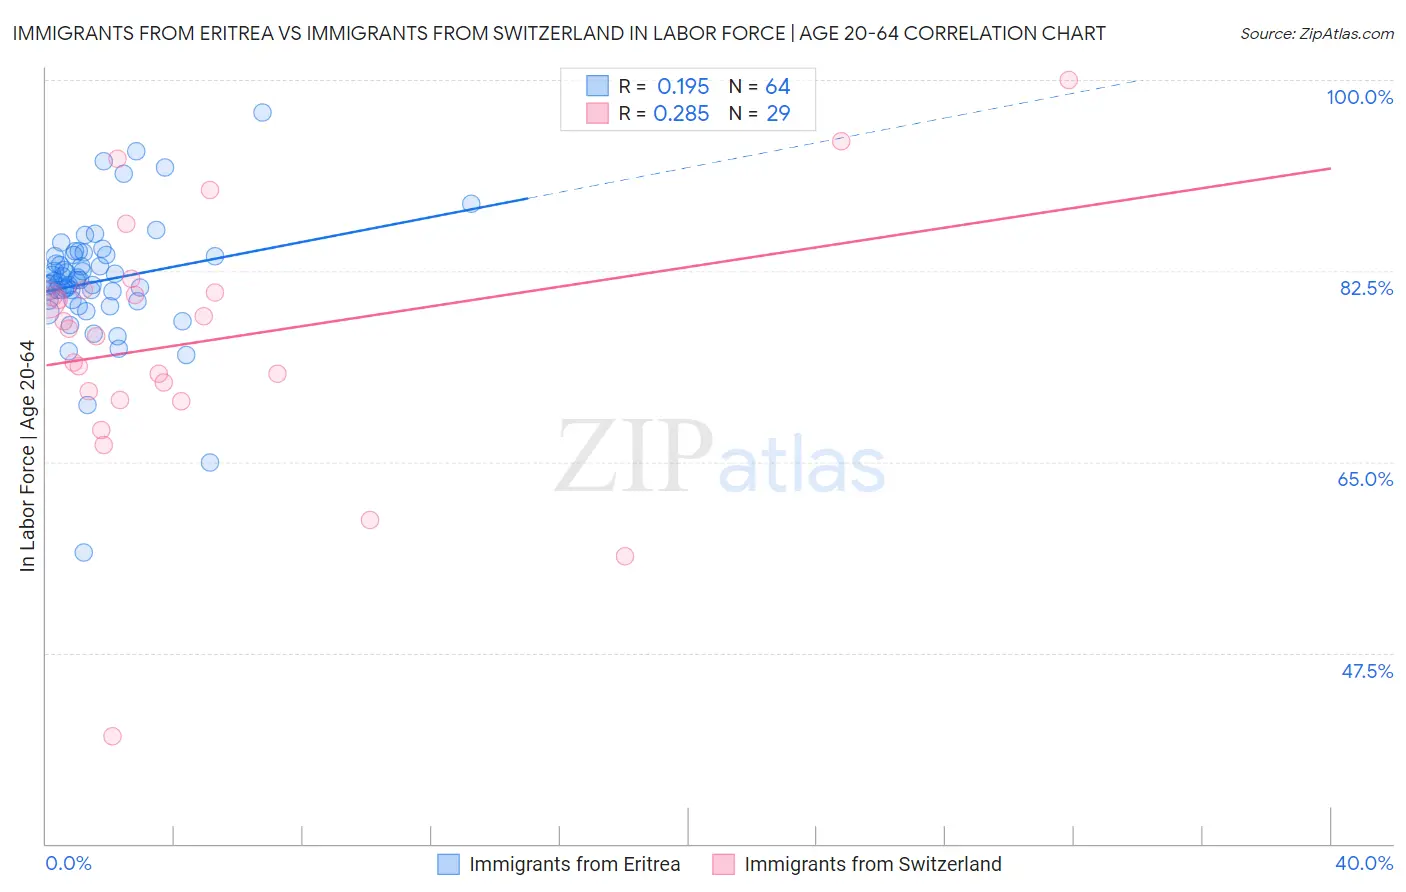
Immigrants from Eritrea vs Immigrants from Switzerland In Labor Force | Age 20-64 Correlation Chart
The statistical analysis conducted on geographies consisting of 104,851,863 people shows a poor positive correlation between the proportion of Immigrants from Eritrea and labor force participation rate among population between the ages 20 and 64 in the United States with a correlation coefficient (R) of 0.195 and weighted average of 81.3%. Similarly, the statistical analysis conducted on geographies consisting of 148,083,469 people shows a weak positive correlation between the proportion of Immigrants from Switzerland and labor force participation rate among population between the ages 20 and 64 in the United States with a correlation coefficient (R) of 0.285 and weighted average of 79.6%, a difference of 2.1%.
In Labor Force | Age 20-64 Correlation Summary
| Measurement | Immigrants from Eritrea | Immigrants from Switzerland |
| Minimum | 56.7% | 39.8% |
| Maximum | 97.0% | 100.0% |
| Range | 40.3% | 60.2% |
| Mean | 81.6% | 76.1% |
| Median | 81.6% | 77.2% |
| Interquartile 25% (IQ1) | 79.9% | 71.1% |
| Interquartile 75% (IQ3) | 83.9% | 80.6% |
| Interquartile Range (IQR) | 4.1% | 9.6% |
| Standard Deviation (Sample) | 5.9% | 11.8% |
| Standard Deviation (Population) | 5.8% | 11.6% |
Similar Demographics by In Labor Force | Age 20-64
Demographics Similar to Immigrants from Eritrea by In Labor Force | Age 20-64
In terms of in labor force | age 20-64, the demographic groups most similar to Immigrants from Eritrea are Immigrants from Eastern Africa (81.3%, a difference of 0.030%), Immigrants from India (81.3%, a difference of 0.030%), Immigrants from Sierra Leone (81.5%, a difference of 0.21%), Cambodian (81.1%, a difference of 0.27%), and Bulgarian (81.1%, a difference of 0.28%).
| Demographics | Rating | Rank | In Labor Force | Age 20-64 |
| Bolivians | 100.0 /100 | #5 | Exceptional 81.7% |
| Somalis | 100.0 /100 | #6 | Exceptional 81.6% |
| Immigrants | Cameroon | 100.0 /100 | #7 | Exceptional 81.6% |
| Immigrants | Somalia | 100.0 /100 | #8 | Exceptional 81.6% |
| Sierra Leoneans | 100.0 /100 | #9 | Exceptional 81.5% |
| Immigrants | Sierra Leone | 100.0 /100 | #10 | Exceptional 81.5% |
| Immigrants | Eastern Africa | 100.0 /100 | #11 | Exceptional 81.3% |
| Immigrants | Eritrea | 100.0 /100 | #12 | Exceptional 81.3% |
| Immigrants | India | 100.0 /100 | #13 | Exceptional 81.3% |
| Cambodians | 100.0 /100 | #14 | Exceptional 81.1% |
| Bulgarians | 100.0 /100 | #15 | Exceptional 81.1% |
| Immigrants | Nepal | 100.0 /100 | #16 | Exceptional 81.1% |
| Norwegians | 100.0 /100 | #17 | Exceptional 81.0% |
| Immigrants | Bulgaria | 100.0 /100 | #18 | Exceptional 81.0% |
| Zimbabweans | 100.0 /100 | #19 | Exceptional 81.0% |
Demographics Similar to Immigrants from Switzerland by In Labor Force | Age 20-64
In terms of in labor force | age 20-64, the demographic groups most similar to Immigrants from Switzerland are Immigrants from Belgium (79.6%, a difference of 0.0%), Slavic (79.6%, a difference of 0.010%), Immigrants from Scotland (79.6%, a difference of 0.010%), Syrian (79.6%, a difference of 0.030%), and Laotian (79.6%, a difference of 0.040%).
| Demographics | Rating | Rank | In Labor Force | Age 20-64 |
| Immigrants | Burma/Myanmar | 64.4 /100 | #164 | Good 79.7% |
| Nigerians | 64.0 /100 | #165 | Good 79.7% |
| Okinawans | 62.7 /100 | #166 | Good 79.6% |
| Immigrants | Iraq | 62.0 /100 | #167 | Good 79.6% |
| Immigrants | Indonesia | 61.8 /100 | #168 | Good 79.6% |
| Laotians | 58.4 /100 | #169 | Average 79.6% |
| Slavs | 54.0 /100 | #170 | Average 79.6% |
| Immigrants | Switzerland | 53.3 /100 | #171 | Average 79.6% |
| Immigrants | Belgium | 53.1 /100 | #172 | Average 79.6% |
| Immigrants | Scotland | 52.4 /100 | #173 | Average 79.6% |
| Syrians | 50.0 /100 | #174 | Average 79.6% |
| Cubans | 46.1 /100 | #175 | Average 79.5% |
| Australians | 46.0 /100 | #176 | Average 79.5% |
| Immigrants | Netherlands | 45.2 /100 | #177 | Average 79.5% |
| Czechoslovakians | 44.3 /100 | #178 | Average 79.5% |