Native Hawaiian vs Nonimmigrants In Labor Force | Age 30-34
COMPARE
Native Hawaiian
Nonimmigrants
In Labor Force | Age 30-34
In Labor Force | Age 30-34 Comparison
Native Hawaiians
Nonimmigrants
83.0%
IN LABOR FORCE | AGE 30-34
0.0/ 100
METRIC RATING
287th/ 347
METRIC RANK
83.5%
IN LABOR FORCE | AGE 30-34
0.0/ 100
METRIC RATING
272nd/ 347
METRIC RANK
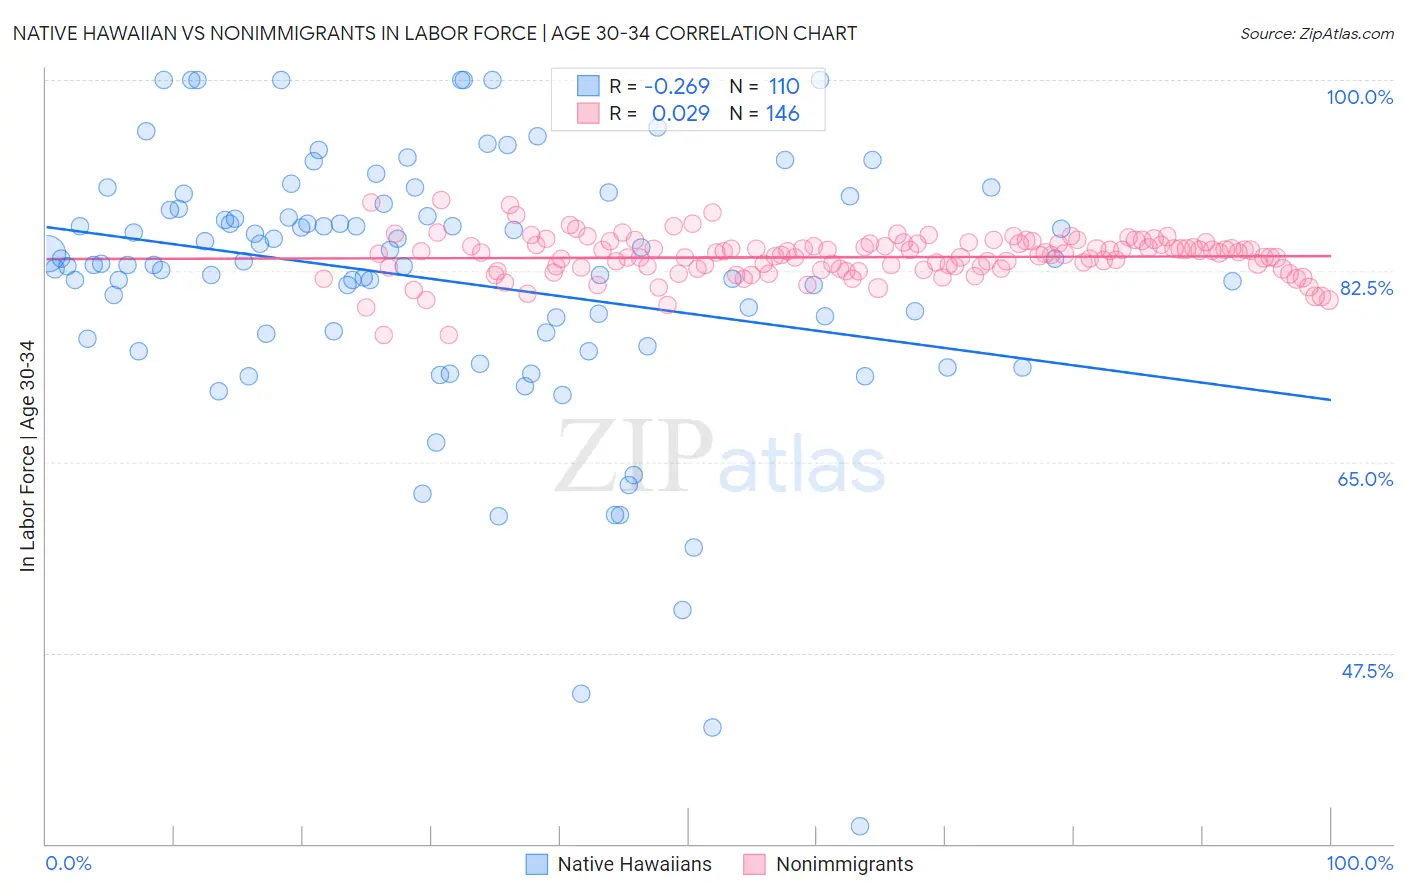
Native Hawaiian vs Nonimmigrants In Labor Force | Age 30-34 Correlation Chart
The statistical analysis conducted on geographies consisting of 331,941,727 people shows a weak negative correlation between the proportion of Native Hawaiians and labor force participation rate among population between the ages 30 and 34 in the United States with a correlation coefficient (R) of -0.269 and weighted average of 83.0%. Similarly, the statistical analysis conducted on geographies consisting of 582,736,501 people shows no correlation between the proportion of Nonimmigrants and labor force participation rate among population between the ages 30 and 34 in the United States with a correlation coefficient (R) of 0.029 and weighted average of 83.5%, a difference of 0.60%.
In Labor Force | Age 30-34 Correlation Summary
| Measurement | Native Hawaiian | Nonimmigrants |
| Minimum | 31.6% | 76.6% |
| Maximum | 100.0% | 89.0% |
| Range | 68.4% | 12.4% |
| Mean | 81.7% | 83.8% |
| Median | 83.3% | 84.1% |
| Interquartile 25% (IQ1) | 76.7% | 82.6% |
| Interquartile 75% (IQ3) | 88.2% | 85.0% |
| Interquartile Range (IQR) | 11.5% | 2.3% |
| Standard Deviation (Sample) | 12.3% | 2.0% |
| Standard Deviation (Population) | 12.2% | 2.0% |
Demographics Similar to Native Hawaiians and Nonimmigrants by In Labor Force | Age 30-34
In terms of in labor force | age 30-34, the demographic groups most similar to Native Hawaiians are Central American Indian (83.0%, a difference of 0.030%), Hawaiian (83.0%, a difference of 0.050%), Immigrants from Latin America (83.1%, a difference of 0.10%), Immigrants from Belize (83.2%, a difference of 0.16%), and Cree (83.2%, a difference of 0.16%). Similarly, the demographic groups most similar to Nonimmigrants are Spanish (83.5%, a difference of 0.0%), Spanish American (83.5%, a difference of 0.020%), Guamanian/Chamorro (83.5%, a difference of 0.050%), Belizean (83.5%, a difference of 0.060%), and Vietnamese (83.6%, a difference of 0.070%).
| Demographics | Rating | Rank | In Labor Force | Age 30-34 |
| Vietnamese | 0.1 /100 | #269 | Tragic 83.6% |
| Spanish Americans | 0.0 /100 | #270 | Tragic 83.5% |
| Spanish | 0.0 /100 | #271 | Tragic 83.5% |
| Immigrants | Nonimmigrants | 0.0 /100 | #272 | Tragic 83.5% |
| Guamanians/Chamorros | 0.0 /100 | #273 | Tragic 83.5% |
| Belizeans | 0.0 /100 | #274 | Tragic 83.5% |
| Immigrants | Grenada | 0.0 /100 | #275 | Tragic 83.5% |
| Tongans | 0.0 /100 | #276 | Tragic 83.5% |
| Delaware | 0.0 /100 | #277 | Tragic 83.5% |
| Fijians | 0.0 /100 | #278 | Tragic 83.4% |
| Immigrants | Fiji | 0.0 /100 | #279 | Tragic 83.4% |
| Africans | 0.0 /100 | #280 | Tragic 83.4% |
| Samoans | 0.0 /100 | #281 | Tragic 83.3% |
| Mexican American Indians | 0.0 /100 | #282 | Tragic 83.2% |
| Assyrians/Chaldeans/Syriacs | 0.0 /100 | #283 | Tragic 83.2% |
| Immigrants | Belize | 0.0 /100 | #284 | Tragic 83.2% |
| Cree | 0.0 /100 | #285 | Tragic 83.2% |
| Immigrants | Latin America | 0.0 /100 | #286 | Tragic 83.1% |
| Native Hawaiians | 0.0 /100 | #287 | Tragic 83.0% |
| Central American Indians | 0.0 /100 | #288 | Tragic 83.0% |
| Hawaiians | 0.0 /100 | #289 | Tragic 83.0% |