Native Hawaiian vs Yup'ik In Labor Force | Age 30-34
COMPARE
Native Hawaiian
Yup'ik
In Labor Force | Age 30-34
In Labor Force | Age 30-34 Comparison
Native Hawaiians
Yup'ik
83.0%
IN LABOR FORCE | AGE 30-34
0.0/ 100
METRIC RATING
287th/ 347
METRIC RANK
76.4%
IN LABOR FORCE | AGE 30-34
0.0/ 100
METRIC RATING
345th/ 347
METRIC RANK
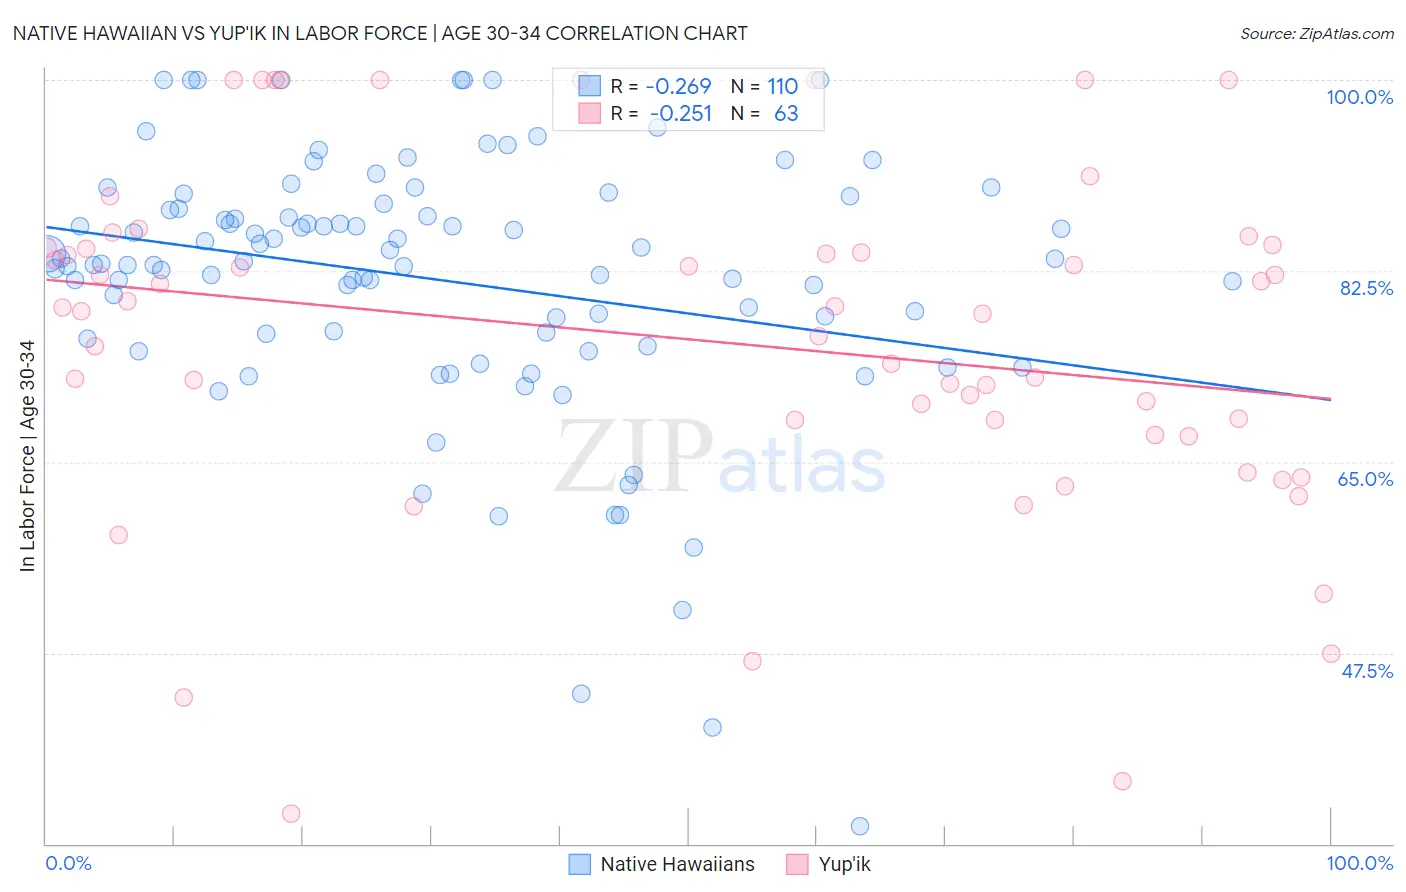
Native Hawaiian vs Yup'ik In Labor Force | Age 30-34 Correlation Chart
The statistical analysis conducted on geographies consisting of 331,941,727 people shows a weak negative correlation between the proportion of Native Hawaiians and labor force participation rate among population between the ages 30 and 34 in the United States with a correlation coefficient (R) of -0.269 and weighted average of 83.0%. Similarly, the statistical analysis conducted on geographies consisting of 39,955,803 people shows a weak negative correlation between the proportion of Yup'ik and labor force participation rate among population between the ages 30 and 34 in the United States with a correlation coefficient (R) of -0.251 and weighted average of 76.4%, a difference of 8.6%.
In Labor Force | Age 30-34 Correlation Summary
| Measurement | Native Hawaiian | Yup'ik |
| Minimum | 31.6% | 32.8% |
| Maximum | 100.0% | 100.0% |
| Range | 68.4% | 67.2% |
| Mean | 81.7% | 76.1% |
| Median | 83.3% | 78.8% |
| Interquartile 25% (IQ1) | 76.7% | 67.5% |
| Interquartile 75% (IQ3) | 88.2% | 84.7% |
| Interquartile Range (IQR) | 11.5% | 17.2% |
| Standard Deviation (Sample) | 12.3% | 15.8% |
| Standard Deviation (Population) | 12.2% | 15.7% |
Similar Demographics by In Labor Force | Age 30-34
Demographics Similar to Native Hawaiians by In Labor Force | Age 30-34
In terms of in labor force | age 30-34, the demographic groups most similar to Native Hawaiians are Central American Indian (83.0%, a difference of 0.030%), Hawaiian (83.0%, a difference of 0.050%), Immigrants from Latin America (83.1%, a difference of 0.10%), Immigrants from Belize (83.2%, a difference of 0.16%), and Cree (83.2%, a difference of 0.16%).
| Demographics | Rating | Rank | In Labor Force | Age 30-34 |
| Africans | 0.0 /100 | #280 | Tragic 83.4% |
| Samoans | 0.0 /100 | #281 | Tragic 83.3% |
| Mexican American Indians | 0.0 /100 | #282 | Tragic 83.2% |
| Assyrians/Chaldeans/Syriacs | 0.0 /100 | #283 | Tragic 83.2% |
| Immigrants | Belize | 0.0 /100 | #284 | Tragic 83.2% |
| Cree | 0.0 /100 | #285 | Tragic 83.2% |
| Immigrants | Latin America | 0.0 /100 | #286 | Tragic 83.1% |
| Native Hawaiians | 0.0 /100 | #287 | Tragic 83.0% |
| Central American Indians | 0.0 /100 | #288 | Tragic 83.0% |
| Hawaiians | 0.0 /100 | #289 | Tragic 83.0% |
| Blackfeet | 0.0 /100 | #290 | Tragic 82.8% |
| Potawatomi | 0.0 /100 | #291 | Tragic 82.8% |
| Blacks/African Americans | 0.0 /100 | #292 | Tragic 82.8% |
| Nepalese | 0.0 /100 | #293 | Tragic 82.7% |
| Americans | 0.0 /100 | #294 | Tragic 82.7% |
Demographics Similar to Yup'ik by In Labor Force | Age 30-34
In terms of in labor force | age 30-34, the demographic groups most similar to Yup'ik are Crow (75.9%, a difference of 0.68%), Yuman (77.1%, a difference of 0.87%), Lumbee (77.3%, a difference of 1.1%), Tohono O'odham (77.7%, a difference of 1.7%), and Immigrants from Yemen (78.2%, a difference of 2.3%).
| Demographics | Rating | Rank | In Labor Force | Age 30-34 |
| Inupiat | 0.0 /100 | #333 | Tragic 79.7% |
| Hopi | 0.0 /100 | #334 | Tragic 79.3% |
| Marshallese | 0.0 /100 | #335 | Tragic 79.2% |
| Natives/Alaskans | 0.0 /100 | #336 | Tragic 79.2% |
| Yakama | 0.0 /100 | #337 | Tragic 79.1% |
| Pima | 0.0 /100 | #338 | Tragic 79.0% |
| Apache | 0.0 /100 | #339 | Tragic 79.0% |
| Ute | 0.0 /100 | #340 | Tragic 78.9% |
| Immigrants | Yemen | 0.0 /100 | #341 | Tragic 78.2% |
| Tohono O'odham | 0.0 /100 | #342 | Tragic 77.7% |
| Lumbee | 0.0 /100 | #343 | Tragic 77.3% |
| Yuman | 0.0 /100 | #344 | Tragic 77.1% |
| Yup'ik | 0.0 /100 | #345 | Tragic 76.4% |
| Crow | 0.0 /100 | #346 | Tragic 75.9% |
| Navajo | 0.0 /100 | #347 | Tragic 73.8% |