Malaysian vs Nonimmigrants In Labor Force | Age 30-34
COMPARE
Malaysian
Nonimmigrants
In Labor Force | Age 30-34
In Labor Force | Age 30-34 Comparison
Malaysians
Nonimmigrants
84.1%
IN LABOR FORCE | AGE 30-34
2.2/ 100
METRIC RATING
231st/ 347
METRIC RANK
83.5%
IN LABOR FORCE | AGE 30-34
0.0/ 100
METRIC RATING
272nd/ 347
METRIC RANK
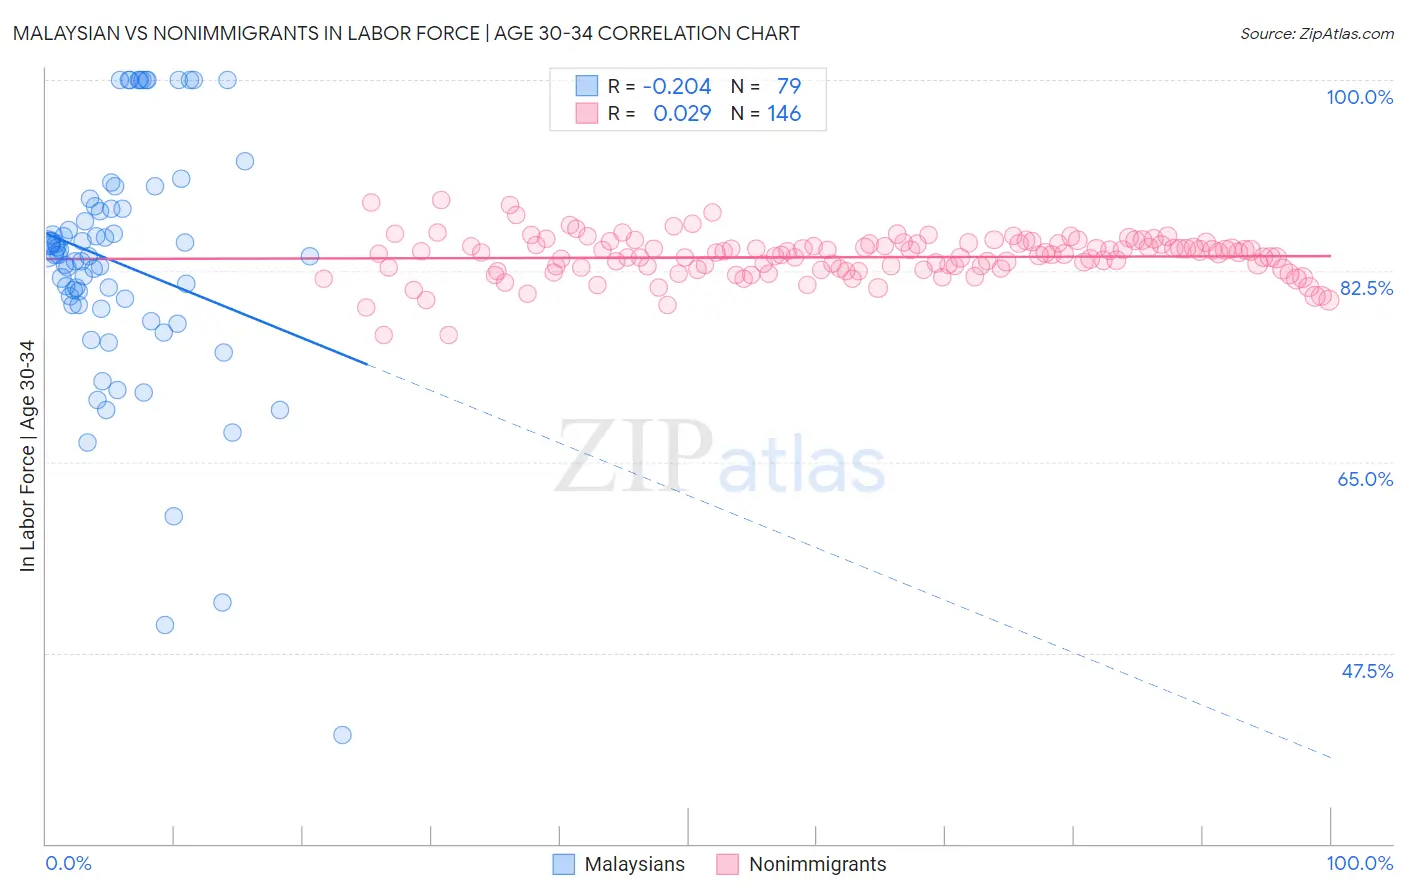
Malaysian vs Nonimmigrants In Labor Force | Age 30-34 Correlation Chart
The statistical analysis conducted on geographies consisting of 226,059,295 people shows a weak negative correlation between the proportion of Malaysians and labor force participation rate among population between the ages 30 and 34 in the United States with a correlation coefficient (R) of -0.204 and weighted average of 84.1%. Similarly, the statistical analysis conducted on geographies consisting of 582,736,501 people shows no correlation between the proportion of Nonimmigrants and labor force participation rate among population between the ages 30 and 34 in the United States with a correlation coefficient (R) of 0.029 and weighted average of 83.5%, a difference of 0.70%.
In Labor Force | Age 30-34 Correlation Summary
| Measurement | Malaysian | Nonimmigrants |
| Minimum | 40.0% | 76.6% |
| Maximum | 100.0% | 89.0% |
| Range | 60.0% | 12.4% |
| Mean | 83.1% | 83.8% |
| Median | 83.9% | 84.1% |
| Interquartile 25% (IQ1) | 79.4% | 82.6% |
| Interquartile 75% (IQ3) | 88.2% | 85.0% |
| Interquartile Range (IQR) | 8.8% | 2.3% |
| Standard Deviation (Sample) | 11.4% | 2.0% |
| Standard Deviation (Population) | 11.3% | 2.0% |
Similar Demographics by In Labor Force | Age 30-34
Demographics Similar to Malaysians by In Labor Force | Age 30-34
In terms of in labor force | age 30-34, the demographic groups most similar to Malaysians are Immigrants (84.1%, a difference of 0.020%), Immigrants from Bahamas (84.1%, a difference of 0.030%), West Indian (84.1%, a difference of 0.030%), Immigrants from Haiti (84.2%, a difference of 0.040%), and Welsh (84.2%, a difference of 0.040%).
| Demographics | Rating | Rank | In Labor Force | Age 30-34 |
| Cubans | 3.4 /100 | #224 | Tragic 84.2% |
| Scottish | 3.1 /100 | #225 | Tragic 84.2% |
| Immigrants | El Salvador | 3.0 /100 | #226 | Tragic 84.2% |
| Immigrants | Cuba | 3.0 /100 | #227 | Tragic 84.2% |
| Immigrants | Haiti | 2.8 /100 | #228 | Tragic 84.2% |
| Welsh | 2.7 /100 | #229 | Tragic 84.2% |
| Immigrants | Bahamas | 2.6 /100 | #230 | Tragic 84.1% |
| Malaysians | 2.2 /100 | #231 | Tragic 84.1% |
| Immigrants | Immigrants | 2.0 /100 | #232 | Tragic 84.1% |
| West Indians | 1.9 /100 | #233 | Tragic 84.1% |
| Haitians | 1.8 /100 | #234 | Tragic 84.1% |
| French American Indians | 1.7 /100 | #235 | Tragic 84.1% |
| U.S. Virgin Islanders | 1.5 /100 | #236 | Tragic 84.1% |
| Celtics | 1.4 /100 | #237 | Tragic 84.1% |
| Immigrants | Barbados | 1.4 /100 | #238 | Tragic 84.0% |
Demographics Similar to Nonimmigrants by In Labor Force | Age 30-34
In terms of in labor force | age 30-34, the demographic groups most similar to Nonimmigrants are Spanish (83.5%, a difference of 0.0%), Spanish American (83.5%, a difference of 0.020%), Guamanian/Chamorro (83.5%, a difference of 0.050%), Belizean (83.5%, a difference of 0.060%), and Vietnamese (83.6%, a difference of 0.070%).
| Demographics | Rating | Rank | In Labor Force | Age 30-34 |
| Immigrants | Honduras | 0.1 /100 | #265 | Tragic 83.7% |
| Immigrants | Guatemala | 0.1 /100 | #266 | Tragic 83.7% |
| Spaniards | 0.1 /100 | #267 | Tragic 83.6% |
| Immigrants | Bangladesh | 0.1 /100 | #268 | Tragic 83.6% |
| Vietnamese | 0.1 /100 | #269 | Tragic 83.6% |
| Spanish Americans | 0.0 /100 | #270 | Tragic 83.5% |
| Spanish | 0.0 /100 | #271 | Tragic 83.5% |
| Immigrants | Nonimmigrants | 0.0 /100 | #272 | Tragic 83.5% |
| Guamanians/Chamorros | 0.0 /100 | #273 | Tragic 83.5% |
| Belizeans | 0.0 /100 | #274 | Tragic 83.5% |
| Immigrants | Grenada | 0.0 /100 | #275 | Tragic 83.5% |
| Tongans | 0.0 /100 | #276 | Tragic 83.5% |
| Delaware | 0.0 /100 | #277 | Tragic 83.5% |
| Fijians | 0.0 /100 | #278 | Tragic 83.4% |
| Immigrants | Fiji | 0.0 /100 | #279 | Tragic 83.4% |