Native Hawaiian vs Immigrants from Japan In Labor Force | Age 30-34
COMPARE
Native Hawaiian
Immigrants from Japan
In Labor Force | Age 30-34
In Labor Force | Age 30-34 Comparison
Native Hawaiians
Immigrants from Japan
83.0%
IN LABOR FORCE | AGE 30-34
0.0/ 100
METRIC RATING
287th/ 347
METRIC RANK
85.4%
IN LABOR FORCE | AGE 30-34
99.1/ 100
METRIC RATING
71st/ 347
METRIC RANK
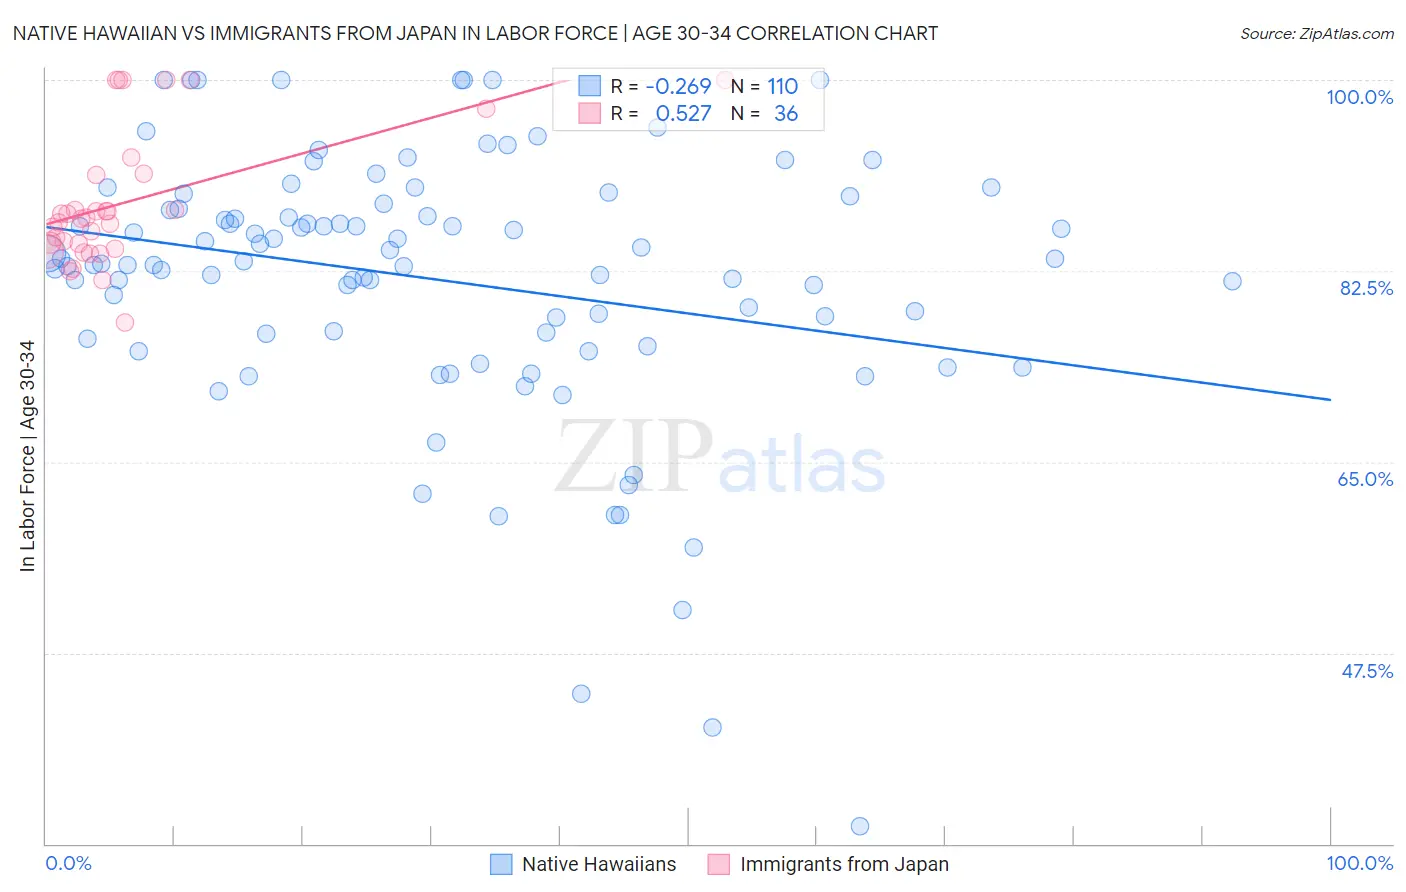
Native Hawaiian vs Immigrants from Japan In Labor Force | Age 30-34 Correlation Chart
The statistical analysis conducted on geographies consisting of 331,941,727 people shows a weak negative correlation between the proportion of Native Hawaiians and labor force participation rate among population between the ages 30 and 34 in the United States with a correlation coefficient (R) of -0.269 and weighted average of 83.0%. Similarly, the statistical analysis conducted on geographies consisting of 340,023,870 people shows a substantial positive correlation between the proportion of Immigrants from Japan and labor force participation rate among population between the ages 30 and 34 in the United States with a correlation coefficient (R) of 0.527 and weighted average of 85.4%, a difference of 2.8%.
In Labor Force | Age 30-34 Correlation Summary
| Measurement | Native Hawaiian | Immigrants from Japan |
| Minimum | 31.6% | 77.8% |
| Maximum | 100.0% | 100.0% |
| Range | 68.4% | 22.2% |
| Mean | 81.7% | 88.8% |
| Median | 83.3% | 87.4% |
| Interquartile 25% (IQ1) | 76.7% | 84.7% |
| Interquartile 75% (IQ3) | 88.2% | 91.3% |
| Interquartile Range (IQR) | 11.5% | 6.6% |
| Standard Deviation (Sample) | 12.3% | 6.1% |
| Standard Deviation (Population) | 12.2% | 6.0% |
Similar Demographics by In Labor Force | Age 30-34
Demographics Similar to Native Hawaiians by In Labor Force | Age 30-34
In terms of in labor force | age 30-34, the demographic groups most similar to Native Hawaiians are Central American Indian (83.0%, a difference of 0.030%), Hawaiian (83.0%, a difference of 0.050%), Immigrants from Latin America (83.1%, a difference of 0.10%), Immigrants from Belize (83.2%, a difference of 0.16%), and Cree (83.2%, a difference of 0.16%).
| Demographics | Rating | Rank | In Labor Force | Age 30-34 |
| Africans | 0.0 /100 | #280 | Tragic 83.4% |
| Samoans | 0.0 /100 | #281 | Tragic 83.3% |
| Mexican American Indians | 0.0 /100 | #282 | Tragic 83.2% |
| Assyrians/Chaldeans/Syriacs | 0.0 /100 | #283 | Tragic 83.2% |
| Immigrants | Belize | 0.0 /100 | #284 | Tragic 83.2% |
| Cree | 0.0 /100 | #285 | Tragic 83.2% |
| Immigrants | Latin America | 0.0 /100 | #286 | Tragic 83.1% |
| Native Hawaiians | 0.0 /100 | #287 | Tragic 83.0% |
| Central American Indians | 0.0 /100 | #288 | Tragic 83.0% |
| Hawaiians | 0.0 /100 | #289 | Tragic 83.0% |
| Blackfeet | 0.0 /100 | #290 | Tragic 82.8% |
| Potawatomi | 0.0 /100 | #291 | Tragic 82.8% |
| Blacks/African Americans | 0.0 /100 | #292 | Tragic 82.8% |
| Nepalese | 0.0 /100 | #293 | Tragic 82.7% |
| Americans | 0.0 /100 | #294 | Tragic 82.7% |
Demographics Similar to Immigrants from Japan by In Labor Force | Age 30-34
In terms of in labor force | age 30-34, the demographic groups most similar to Immigrants from Japan are Brazilian (85.4%, a difference of 0.0%), Immigrants from China (85.4%, a difference of 0.0%), Indian (Asian) (85.4%, a difference of 0.010%), Maltese (85.4%, a difference of 0.010%), and Immigrants from Czechoslovakia (85.4%, a difference of 0.010%).
| Demographics | Rating | Rank | In Labor Force | Age 30-34 |
| Italians | 99.4 /100 | #64 | Exceptional 85.4% |
| Senegalese | 99.4 /100 | #65 | Exceptional 85.4% |
| Ghanaians | 99.4 /100 | #66 | Exceptional 85.4% |
| Kenyans | 99.3 /100 | #67 | Exceptional 85.4% |
| Immigrants | Eastern Europe | 99.3 /100 | #68 | Exceptional 85.4% |
| Immigrants | Iran | 99.2 /100 | #69 | Exceptional 85.4% |
| Brazilians | 99.1 /100 | #70 | Exceptional 85.4% |
| Immigrants | Japan | 99.1 /100 | #71 | Exceptional 85.4% |
| Immigrants | China | 99.0 /100 | #72 | Exceptional 85.4% |
| Indians (Asian) | 99.0 /100 | #73 | Exceptional 85.4% |
| Maltese | 99.0 /100 | #74 | Exceptional 85.4% |
| Immigrants | Czechoslovakia | 99.0 /100 | #75 | Exceptional 85.4% |
| Iranians | 99.0 /100 | #76 | Exceptional 85.4% |
| Immigrants | Eastern Asia | 98.9 /100 | #77 | Exceptional 85.4% |
| Immigrants | Singapore | 98.8 /100 | #78 | Exceptional 85.3% |