Alaska Native vs Nonimmigrants In Labor Force | Age 30-34
COMPARE
Alaska Native
Nonimmigrants
In Labor Force | Age 30-34
In Labor Force | Age 30-34 Comparison
Alaska Natives
Nonimmigrants
81.3%
IN LABOR FORCE | AGE 30-34
0.0/ 100
METRIC RATING
321st/ 347
METRIC RANK
83.5%
IN LABOR FORCE | AGE 30-34
0.0/ 100
METRIC RATING
272nd/ 347
METRIC RANK
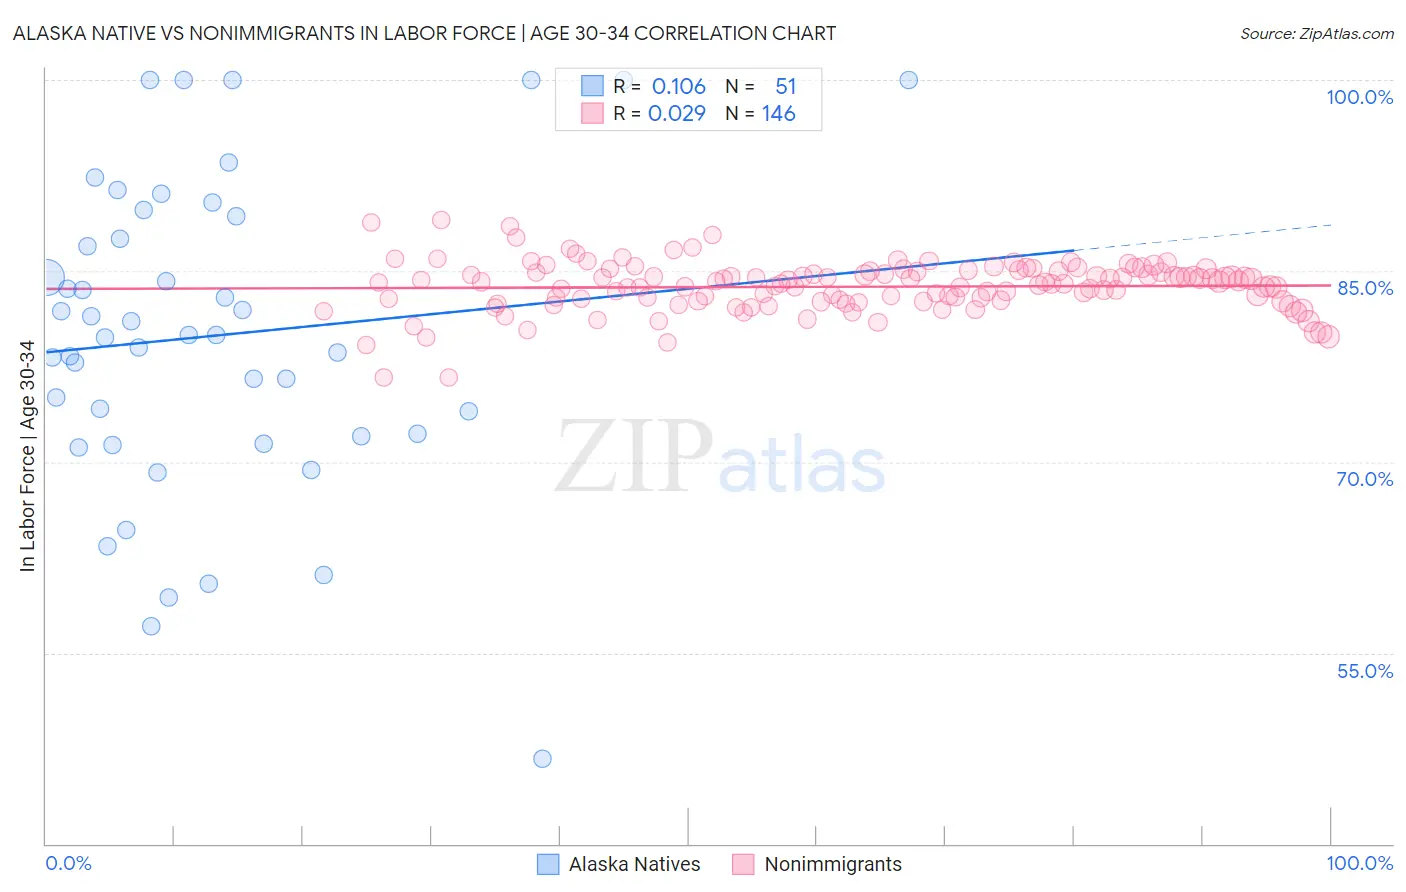
Alaska Native vs Nonimmigrants In Labor Force | Age 30-34 Correlation Chart
The statistical analysis conducted on geographies consisting of 76,755,114 people shows a poor positive correlation between the proportion of Alaska Natives and labor force participation rate among population between the ages 30 and 34 in the United States with a correlation coefficient (R) of 0.106 and weighted average of 81.3%. Similarly, the statistical analysis conducted on geographies consisting of 582,736,501 people shows no correlation between the proportion of Nonimmigrants and labor force participation rate among population between the ages 30 and 34 in the United States with a correlation coefficient (R) of 0.029 and weighted average of 83.5%, a difference of 2.7%.
In Labor Force | Age 30-34 Correlation Summary
| Measurement | Alaska Native | Nonimmigrants |
| Minimum | 46.7% | 76.6% |
| Maximum | 100.0% | 89.0% |
| Range | 53.3% | 12.4% |
| Mean | 79.9% | 83.8% |
| Median | 80.0% | 84.1% |
| Interquartile 25% (IQ1) | 72.0% | 82.6% |
| Interquartile 75% (IQ3) | 89.3% | 85.0% |
| Interquartile Range (IQR) | 17.3% | 2.3% |
| Standard Deviation (Sample) | 12.2% | 2.0% |
| Standard Deviation (Population) | 12.1% | 2.0% |
Similar Demographics by In Labor Force | Age 30-34
Demographics Similar to Alaska Natives by In Labor Force | Age 30-34
In terms of in labor force | age 30-34, the demographic groups most similar to Alaska Natives are Yaqui (81.4%, a difference of 0.080%), Choctaw (81.4%, a difference of 0.10%), Shoshone (81.4%, a difference of 0.10%), Puerto Rican (81.2%, a difference of 0.16%), and Immigrants from the Azores (81.5%, a difference of 0.18%).
| Demographics | Rating | Rank | In Labor Force | Age 30-34 |
| Alaskan Athabascans | 0.0 /100 | #314 | Tragic 81.7% |
| Cherokee | 0.0 /100 | #315 | Tragic 81.6% |
| Immigrants | Azores | 0.0 /100 | #316 | Tragic 81.5% |
| Arapaho | 0.0 /100 | #317 | Tragic 81.5% |
| Choctaw | 0.0 /100 | #318 | Tragic 81.4% |
| Shoshone | 0.0 /100 | #319 | Tragic 81.4% |
| Yaqui | 0.0 /100 | #320 | Tragic 81.4% |
| Alaska Natives | 0.0 /100 | #321 | Tragic 81.3% |
| Puerto Ricans | 0.0 /100 | #322 | Tragic 81.2% |
| Paiute | 0.0 /100 | #323 | Tragic 81.2% |
| Cheyenne | 0.0 /100 | #324 | Tragic 81.1% |
| Dutch West Indians | 0.0 /100 | #325 | Tragic 81.0% |
| Seminole | 0.0 /100 | #326 | Tragic 80.8% |
| Colville | 0.0 /100 | #327 | Tragic 80.7% |
| Sioux | 0.0 /100 | #328 | Tragic 80.4% |
Demographics Similar to Nonimmigrants by In Labor Force | Age 30-34
In terms of in labor force | age 30-34, the demographic groups most similar to Nonimmigrants are Spanish (83.5%, a difference of 0.0%), Spanish American (83.5%, a difference of 0.020%), Guamanian/Chamorro (83.5%, a difference of 0.050%), Belizean (83.5%, a difference of 0.060%), and Vietnamese (83.6%, a difference of 0.070%).
| Demographics | Rating | Rank | In Labor Force | Age 30-34 |
| Immigrants | Honduras | 0.1 /100 | #265 | Tragic 83.7% |
| Immigrants | Guatemala | 0.1 /100 | #266 | Tragic 83.7% |
| Spaniards | 0.1 /100 | #267 | Tragic 83.6% |
| Immigrants | Bangladesh | 0.1 /100 | #268 | Tragic 83.6% |
| Vietnamese | 0.1 /100 | #269 | Tragic 83.6% |
| Spanish Americans | 0.0 /100 | #270 | Tragic 83.5% |
| Spanish | 0.0 /100 | #271 | Tragic 83.5% |
| Immigrants | Nonimmigrants | 0.0 /100 | #272 | Tragic 83.5% |
| Guamanians/Chamorros | 0.0 /100 | #273 | Tragic 83.5% |
| Belizeans | 0.0 /100 | #274 | Tragic 83.5% |
| Immigrants | Grenada | 0.0 /100 | #275 | Tragic 83.5% |
| Tongans | 0.0 /100 | #276 | Tragic 83.5% |
| Delaware | 0.0 /100 | #277 | Tragic 83.5% |
| Fijians | 0.0 /100 | #278 | Tragic 83.4% |
| Immigrants | Fiji | 0.0 /100 | #279 | Tragic 83.4% |