Immigrants from Northern Africa vs Nonimmigrants In Labor Force | Age 30-34
COMPARE
Immigrants from Northern Africa
Nonimmigrants
In Labor Force | Age 30-34
In Labor Force | Age 30-34 Comparison
Immigrants from Northern Africa
Nonimmigrants
85.2%
IN LABOR FORCE | AGE 30-34
96.3/ 100
METRIC RATING
107th/ 347
METRIC RANK
83.5%
IN LABOR FORCE | AGE 30-34
0.0/ 100
METRIC RATING
272nd/ 347
METRIC RANK
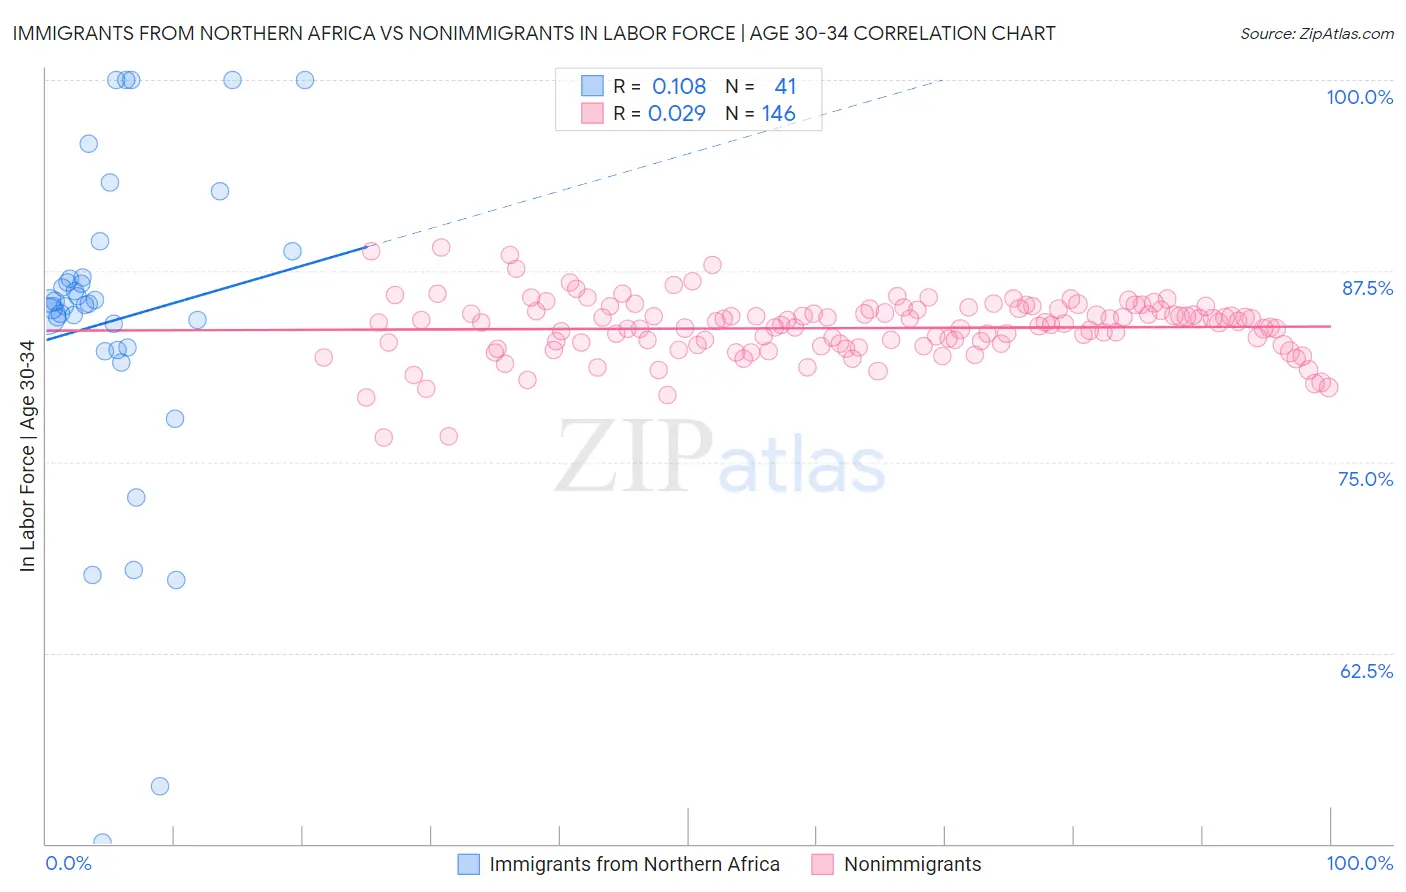
Immigrants from Northern Africa vs Nonimmigrants In Labor Force | Age 30-34 Correlation Chart
The statistical analysis conducted on geographies consisting of 321,096,130 people shows a poor positive correlation between the proportion of Immigrants from Northern Africa and labor force participation rate among population between the ages 30 and 34 in the United States with a correlation coefficient (R) of 0.108 and weighted average of 85.2%. Similarly, the statistical analysis conducted on geographies consisting of 582,736,501 people shows no correlation between the proportion of Nonimmigrants and labor force participation rate among population between the ages 30 and 34 in the United States with a correlation coefficient (R) of 0.029 and weighted average of 83.5%, a difference of 2.0%.
In Labor Force | Age 30-34 Correlation Summary
| Measurement | Immigrants from Northern Africa | Nonimmigrants |
| Minimum | 50.1% | 76.6% |
| Maximum | 100.0% | 89.0% |
| Range | 49.9% | 12.4% |
| Mean | 84.3% | 83.8% |
| Median | 85.3% | 84.1% |
| Interquartile 25% (IQ1) | 82.4% | 82.6% |
| Interquartile 75% (IQ3) | 88.0% | 85.0% |
| Interquartile Range (IQR) | 5.5% | 2.3% |
| Standard Deviation (Sample) | 10.9% | 2.0% |
| Standard Deviation (Population) | 10.8% | 2.0% |
Similar Demographics by In Labor Force | Age 30-34
Demographics Similar to Immigrants from Northern Africa by In Labor Force | Age 30-34
In terms of in labor force | age 30-34, the demographic groups most similar to Immigrants from Northern Africa are Alsatian (85.2%, a difference of 0.0%), Immigrants from Middle Africa (85.2%, a difference of 0.0%), Ukrainian (85.2%, a difference of 0.010%), Immigrants from Ghana (85.2%, a difference of 0.010%), and Immigrants from Zimbabwe (85.1%, a difference of 0.020%).
| Demographics | Rating | Rank | In Labor Force | Age 30-34 |
| Sudanese | 97.1 /100 | #100 | Exceptional 85.2% |
| Immigrants | Belarus | 96.9 /100 | #101 | Exceptional 85.2% |
| Immigrants | Austria | 96.8 /100 | #102 | Exceptional 85.2% |
| Ukrainians | 96.6 /100 | #103 | Exceptional 85.2% |
| Immigrants | Ghana | 96.5 /100 | #104 | Exceptional 85.2% |
| Alsatians | 96.3 /100 | #105 | Exceptional 85.2% |
| Immigrants | Middle Africa | 96.3 /100 | #106 | Exceptional 85.2% |
| Immigrants | Northern Africa | 96.3 /100 | #107 | Exceptional 85.2% |
| Immigrants | Zimbabwe | 95.8 /100 | #108 | Exceptional 85.1% |
| Argentineans | 95.8 /100 | #109 | Exceptional 85.1% |
| Immigrants | South Africa | 95.3 /100 | #110 | Exceptional 85.1% |
| Immigrants | Scotland | 94.9 /100 | #111 | Exceptional 85.1% |
| Immigrants | Hungary | 94.8 /100 | #112 | Exceptional 85.1% |
| Immigrants | Romania | 94.7 /100 | #113 | Exceptional 85.1% |
| Yugoslavians | 94.7 /100 | #114 | Exceptional 85.1% |
Demographics Similar to Nonimmigrants by In Labor Force | Age 30-34
In terms of in labor force | age 30-34, the demographic groups most similar to Nonimmigrants are Spanish (83.5%, a difference of 0.0%), Spanish American (83.5%, a difference of 0.020%), Guamanian/Chamorro (83.5%, a difference of 0.050%), Belizean (83.5%, a difference of 0.060%), and Vietnamese (83.6%, a difference of 0.070%).
| Demographics | Rating | Rank | In Labor Force | Age 30-34 |
| Immigrants | Honduras | 0.1 /100 | #265 | Tragic 83.7% |
| Immigrants | Guatemala | 0.1 /100 | #266 | Tragic 83.7% |
| Spaniards | 0.1 /100 | #267 | Tragic 83.6% |
| Immigrants | Bangladesh | 0.1 /100 | #268 | Tragic 83.6% |
| Vietnamese | 0.1 /100 | #269 | Tragic 83.6% |
| Spanish Americans | 0.0 /100 | #270 | Tragic 83.5% |
| Spanish | 0.0 /100 | #271 | Tragic 83.5% |
| Immigrants | Nonimmigrants | 0.0 /100 | #272 | Tragic 83.5% |
| Guamanians/Chamorros | 0.0 /100 | #273 | Tragic 83.5% |
| Belizeans | 0.0 /100 | #274 | Tragic 83.5% |
| Immigrants | Grenada | 0.0 /100 | #275 | Tragic 83.5% |
| Tongans | 0.0 /100 | #276 | Tragic 83.5% |
| Delaware | 0.0 /100 | #277 | Tragic 83.5% |
| Fijians | 0.0 /100 | #278 | Tragic 83.4% |
| Immigrants | Fiji | 0.0 /100 | #279 | Tragic 83.4% |