Native Hawaiian vs Cheyenne In Labor Force | Age 30-34
COMPARE
Native Hawaiian
Cheyenne
In Labor Force | Age 30-34
In Labor Force | Age 30-34 Comparison
Native Hawaiians
Cheyenne
83.0%
IN LABOR FORCE | AGE 30-34
0.0/ 100
METRIC RATING
287th/ 347
METRIC RANK
81.1%
IN LABOR FORCE | AGE 30-34
0.0/ 100
METRIC RATING
324th/ 347
METRIC RANK
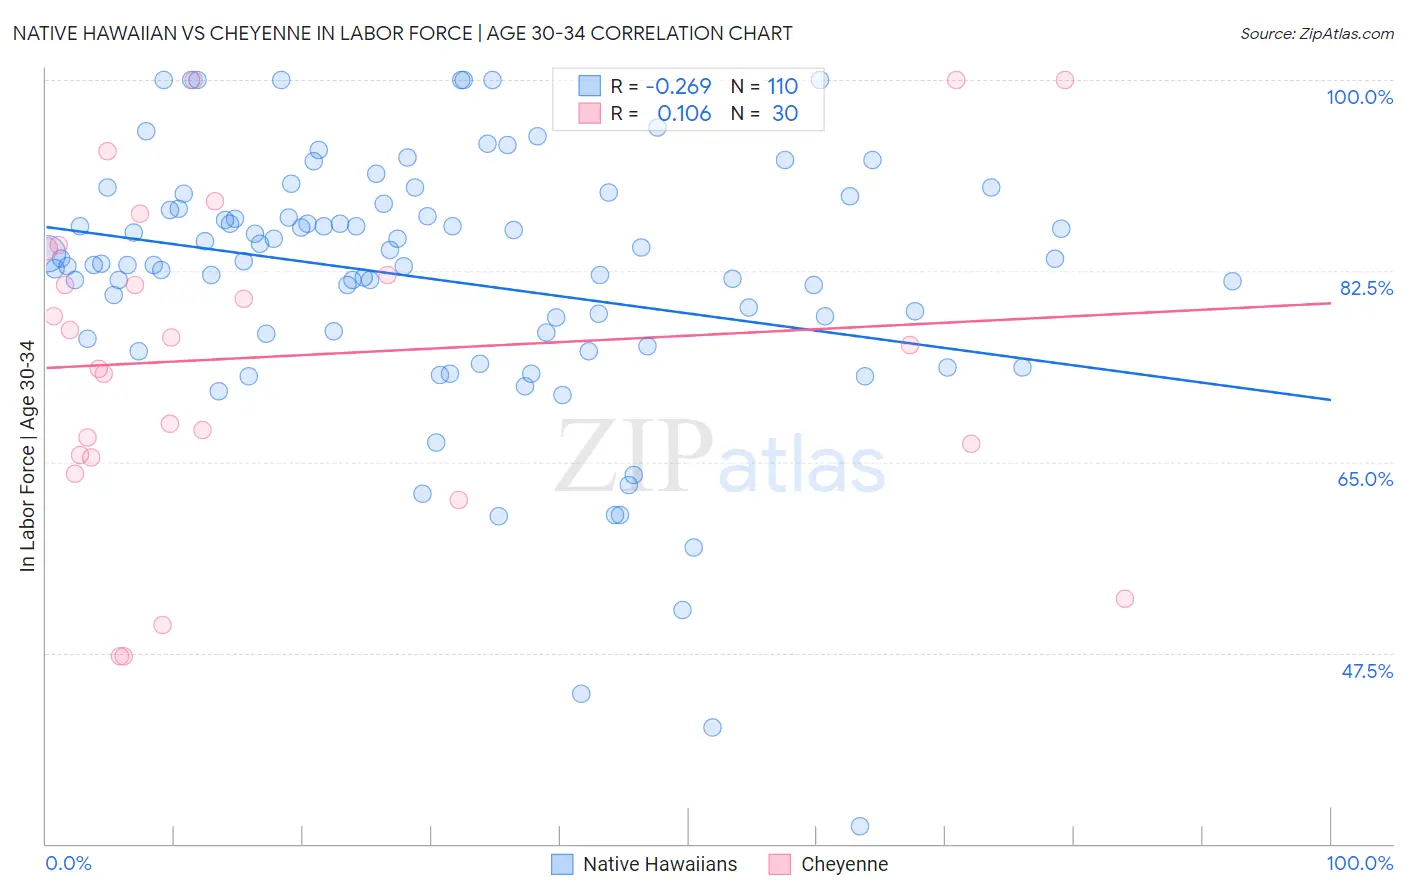
Native Hawaiian vs Cheyenne In Labor Force | Age 30-34 Correlation Chart
The statistical analysis conducted on geographies consisting of 331,941,727 people shows a weak negative correlation between the proportion of Native Hawaiians and labor force participation rate among population between the ages 30 and 34 in the United States with a correlation coefficient (R) of -0.269 and weighted average of 83.0%. Similarly, the statistical analysis conducted on geographies consisting of 80,694,830 people shows a poor positive correlation between the proportion of Cheyenne and labor force participation rate among population between the ages 30 and 34 in the United States with a correlation coefficient (R) of 0.106 and weighted average of 81.1%, a difference of 2.3%.
In Labor Force | Age 30-34 Correlation Summary
| Measurement | Native Hawaiian | Cheyenne |
| Minimum | 31.6% | 47.1% |
| Maximum | 100.0% | 100.0% |
| Range | 68.4% | 52.9% |
| Mean | 81.7% | 74.7% |
| Median | 83.3% | 76.0% |
| Interquartile 25% (IQ1) | 76.7% | 65.6% |
| Interquartile 75% (IQ3) | 88.2% | 84.5% |
| Interquartile Range (IQR) | 11.5% | 18.9% |
| Standard Deviation (Sample) | 12.3% | 14.8% |
| Standard Deviation (Population) | 12.2% | 14.5% |
Similar Demographics by In Labor Force | Age 30-34
Demographics Similar to Native Hawaiians by In Labor Force | Age 30-34
In terms of in labor force | age 30-34, the demographic groups most similar to Native Hawaiians are Central American Indian (83.0%, a difference of 0.030%), Hawaiian (83.0%, a difference of 0.050%), Immigrants from Latin America (83.1%, a difference of 0.10%), Immigrants from Belize (83.2%, a difference of 0.16%), and Cree (83.2%, a difference of 0.16%).
| Demographics | Rating | Rank | In Labor Force | Age 30-34 |
| Africans | 0.0 /100 | #280 | Tragic 83.4% |
| Samoans | 0.0 /100 | #281 | Tragic 83.3% |
| Mexican American Indians | 0.0 /100 | #282 | Tragic 83.2% |
| Assyrians/Chaldeans/Syriacs | 0.0 /100 | #283 | Tragic 83.2% |
| Immigrants | Belize | 0.0 /100 | #284 | Tragic 83.2% |
| Cree | 0.0 /100 | #285 | Tragic 83.2% |
| Immigrants | Latin America | 0.0 /100 | #286 | Tragic 83.1% |
| Native Hawaiians | 0.0 /100 | #287 | Tragic 83.0% |
| Central American Indians | 0.0 /100 | #288 | Tragic 83.0% |
| Hawaiians | 0.0 /100 | #289 | Tragic 83.0% |
| Blackfeet | 0.0 /100 | #290 | Tragic 82.8% |
| Potawatomi | 0.0 /100 | #291 | Tragic 82.8% |
| Blacks/African Americans | 0.0 /100 | #292 | Tragic 82.8% |
| Nepalese | 0.0 /100 | #293 | Tragic 82.7% |
| Americans | 0.0 /100 | #294 | Tragic 82.7% |
Demographics Similar to Cheyenne by In Labor Force | Age 30-34
In terms of in labor force | age 30-34, the demographic groups most similar to Cheyenne are Paiute (81.2%, a difference of 0.030%), Puerto Rican (81.2%, a difference of 0.080%), Dutch West Indian (81.0%, a difference of 0.15%), Alaska Native (81.3%, a difference of 0.24%), and Yaqui (81.4%, a difference of 0.32%).
| Demographics | Rating | Rank | In Labor Force | Age 30-34 |
| Arapaho | 0.0 /100 | #317 | Tragic 81.5% |
| Choctaw | 0.0 /100 | #318 | Tragic 81.4% |
| Shoshone | 0.0 /100 | #319 | Tragic 81.4% |
| Yaqui | 0.0 /100 | #320 | Tragic 81.4% |
| Alaska Natives | 0.0 /100 | #321 | Tragic 81.3% |
| Puerto Ricans | 0.0 /100 | #322 | Tragic 81.2% |
| Paiute | 0.0 /100 | #323 | Tragic 81.2% |
| Cheyenne | 0.0 /100 | #324 | Tragic 81.1% |
| Dutch West Indians | 0.0 /100 | #325 | Tragic 81.0% |
| Seminole | 0.0 /100 | #326 | Tragic 80.8% |
| Colville | 0.0 /100 | #327 | Tragic 80.7% |
| Sioux | 0.0 /100 | #328 | Tragic 80.4% |
| Creek | 0.0 /100 | #329 | Tragic 80.4% |
| Pueblo | 0.0 /100 | #330 | Tragic 80.0% |
| Houma | 0.0 /100 | #331 | Tragic 79.9% |