Native Hawaiian vs Basque In Labor Force | Age 30-34
COMPARE
Native Hawaiian
Basque
In Labor Force | Age 30-34
In Labor Force | Age 30-34 Comparison
Native Hawaiians
Basques
83.0%
IN LABOR FORCE | AGE 30-34
0.0/ 100
METRIC RATING
287th/ 347
METRIC RANK
84.0%
IN LABOR FORCE | AGE 30-34
0.9/ 100
METRIC RATING
244th/ 347
METRIC RANK
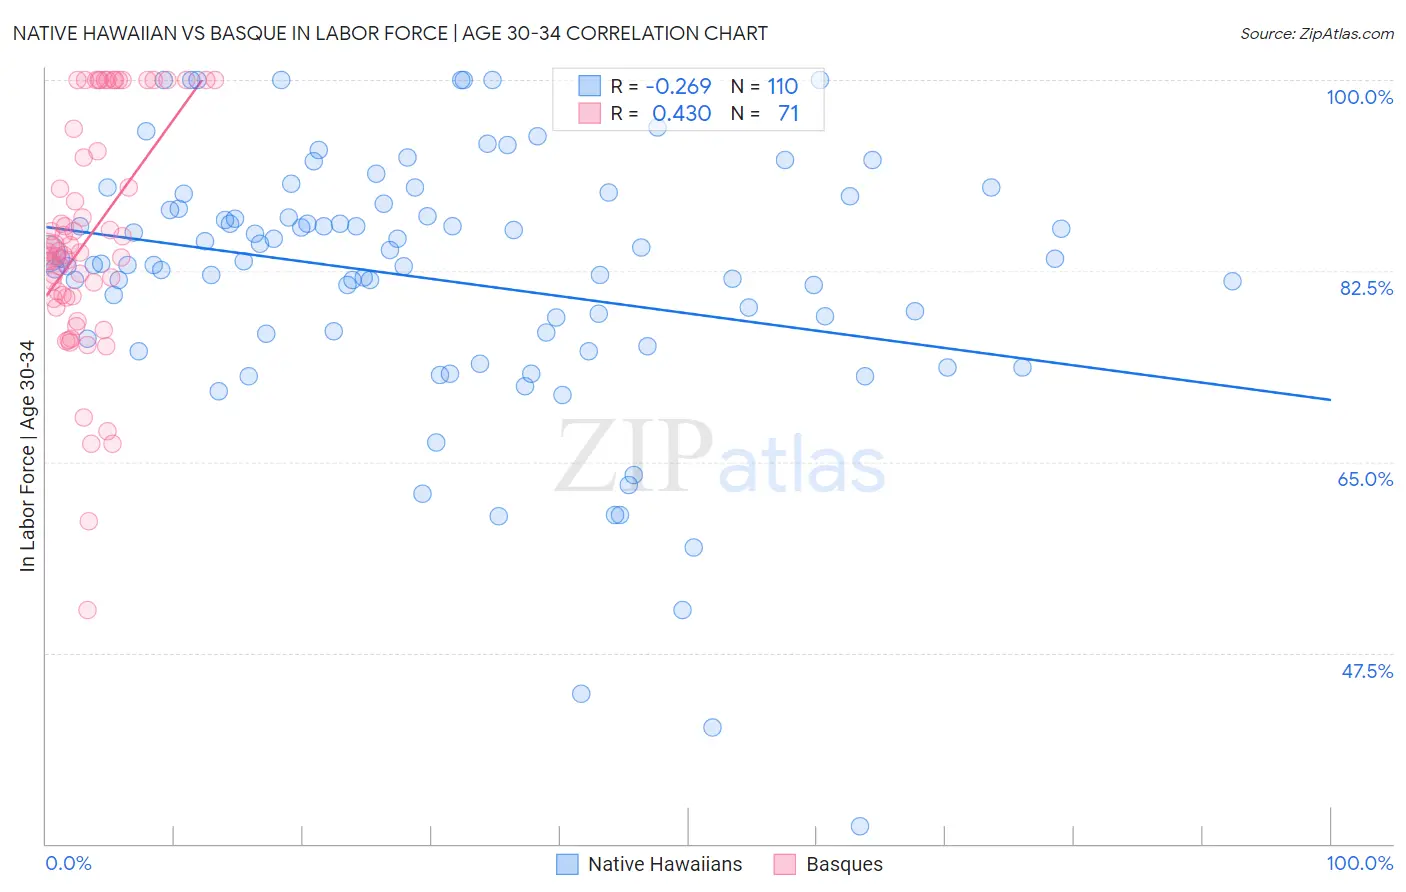
Native Hawaiian vs Basque In Labor Force | Age 30-34 Correlation Chart
The statistical analysis conducted on geographies consisting of 331,941,727 people shows a weak negative correlation between the proportion of Native Hawaiians and labor force participation rate among population between the ages 30 and 34 in the United States with a correlation coefficient (R) of -0.269 and weighted average of 83.0%. Similarly, the statistical analysis conducted on geographies consisting of 165,739,384 people shows a moderate positive correlation between the proportion of Basques and labor force participation rate among population between the ages 30 and 34 in the United States with a correlation coefficient (R) of 0.430 and weighted average of 84.0%, a difference of 1.1%.
In Labor Force | Age 30-34 Correlation Summary
| Measurement | Native Hawaiian | Basque |
| Minimum | 31.6% | 51.4% |
| Maximum | 100.0% | 100.0% |
| Range | 68.4% | 48.6% |
| Mean | 81.7% | 85.6% |
| Median | 83.3% | 84.2% |
| Interquartile 25% (IQ1) | 76.7% | 80.1% |
| Interquartile 75% (IQ3) | 88.2% | 95.5% |
| Interquartile Range (IQR) | 11.5% | 15.4% |
| Standard Deviation (Sample) | 12.3% | 10.7% |
| Standard Deviation (Population) | 12.2% | 10.6% |
Similar Demographics by In Labor Force | Age 30-34
Demographics Similar to Native Hawaiians by In Labor Force | Age 30-34
In terms of in labor force | age 30-34, the demographic groups most similar to Native Hawaiians are Central American Indian (83.0%, a difference of 0.030%), Hawaiian (83.0%, a difference of 0.050%), Immigrants from Latin America (83.1%, a difference of 0.10%), Immigrants from Belize (83.2%, a difference of 0.16%), and Cree (83.2%, a difference of 0.16%).
| Demographics | Rating | Rank | In Labor Force | Age 30-34 |
| Africans | 0.0 /100 | #280 | Tragic 83.4% |
| Samoans | 0.0 /100 | #281 | Tragic 83.3% |
| Mexican American Indians | 0.0 /100 | #282 | Tragic 83.2% |
| Assyrians/Chaldeans/Syriacs | 0.0 /100 | #283 | Tragic 83.2% |
| Immigrants | Belize | 0.0 /100 | #284 | Tragic 83.2% |
| Cree | 0.0 /100 | #285 | Tragic 83.2% |
| Immigrants | Latin America | 0.0 /100 | #286 | Tragic 83.1% |
| Native Hawaiians | 0.0 /100 | #287 | Tragic 83.0% |
| Central American Indians | 0.0 /100 | #288 | Tragic 83.0% |
| Hawaiians | 0.0 /100 | #289 | Tragic 83.0% |
| Blackfeet | 0.0 /100 | #290 | Tragic 82.8% |
| Potawatomi | 0.0 /100 | #291 | Tragic 82.8% |
| Blacks/African Americans | 0.0 /100 | #292 | Tragic 82.8% |
| Nepalese | 0.0 /100 | #293 | Tragic 82.7% |
| Americans | 0.0 /100 | #294 | Tragic 82.7% |
Demographics Similar to Basques by In Labor Force | Age 30-34
In terms of in labor force | age 30-34, the demographic groups most similar to Basques are Immigrants from Venezuela (84.0%, a difference of 0.0%), Central American (84.0%, a difference of 0.0%), British West Indian (84.0%, a difference of 0.020%), Immigrants from Caribbean (84.0%, a difference of 0.030%), and Portuguese (84.0%, a difference of 0.030%).
| Demographics | Rating | Rank | In Labor Force | Age 30-34 |
| Celtics | 1.4 /100 | #237 | Tragic 84.1% |
| Immigrants | Barbados | 1.4 /100 | #238 | Tragic 84.0% |
| English | 1.4 /100 | #239 | Tragic 84.0% |
| Venezuelans | 1.3 /100 | #240 | Tragic 84.0% |
| Immigrants | Portugal | 1.2 /100 | #241 | Tragic 84.0% |
| Immigrants | Oceania | 1.1 /100 | #242 | Tragic 84.0% |
| Immigrants | Caribbean | 1.1 /100 | #243 | Tragic 84.0% |
| Basques | 0.9 /100 | #244 | Tragic 84.0% |
| Immigrants | Venezuela | 0.9 /100 | #245 | Tragic 84.0% |
| Central Americans | 0.9 /100 | #246 | Tragic 84.0% |
| British West Indians | 0.8 /100 | #247 | Tragic 84.0% |
| Portuguese | 0.8 /100 | #248 | Tragic 84.0% |
| Immigrants | Dominica | 0.7 /100 | #249 | Tragic 84.0% |
| Immigrants | Iraq | 0.7 /100 | #250 | Tragic 83.9% |
| Nicaraguans | 0.6 /100 | #251 | Tragic 83.9% |