Immigrants from Morocco vs Nonimmigrants In Labor Force | Age 30-34
COMPARE
Immigrants from Morocco
Nonimmigrants
In Labor Force | Age 30-34
In Labor Force | Age 30-34 Comparison
Immigrants from Morocco
Nonimmigrants
85.6%
IN LABOR FORCE | AGE 30-34
99.8/ 100
METRIC RATING
46th/ 347
METRIC RANK
83.5%
IN LABOR FORCE | AGE 30-34
0.0/ 100
METRIC RATING
272nd/ 347
METRIC RANK
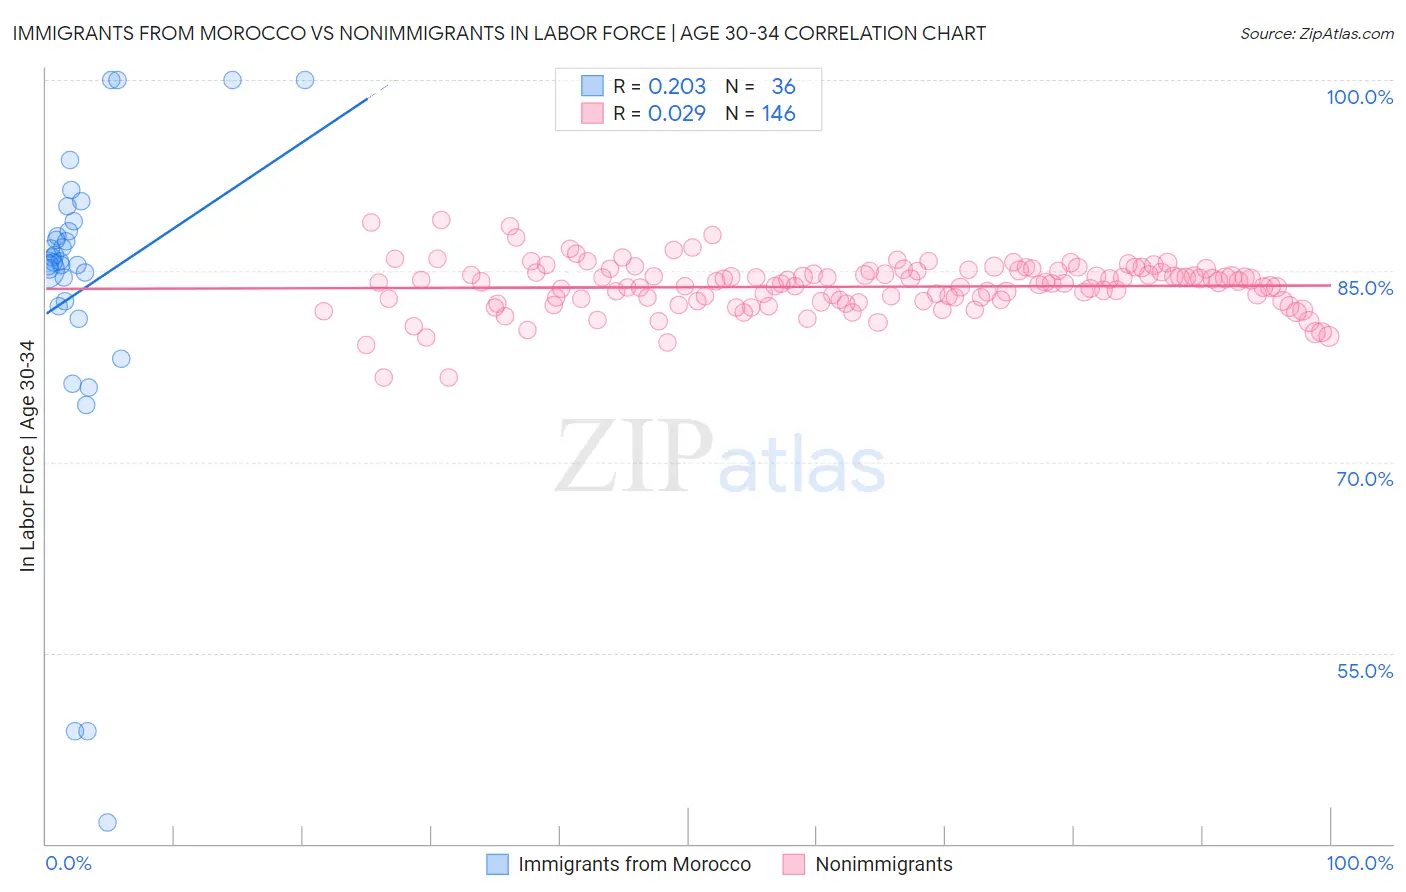
Immigrants from Morocco vs Nonimmigrants In Labor Force | Age 30-34 Correlation Chart
The statistical analysis conducted on geographies consisting of 178,904,869 people shows a weak positive correlation between the proportion of Immigrants from Morocco and labor force participation rate among population between the ages 30 and 34 in the United States with a correlation coefficient (R) of 0.203 and weighted average of 85.6%. Similarly, the statistical analysis conducted on geographies consisting of 582,736,501 people shows no correlation between the proportion of Nonimmigrants and labor force participation rate among population between the ages 30 and 34 in the United States with a correlation coefficient (R) of 0.029 and weighted average of 83.5%, a difference of 2.5%.
In Labor Force | Age 30-34 Correlation Summary
| Measurement | Immigrants from Morocco | Nonimmigrants |
| Minimum | 41.7% | 76.6% |
| Maximum | 100.0% | 89.0% |
| Range | 58.3% | 12.4% |
| Mean | 83.6% | 83.8% |
| Median | 85.7% | 84.1% |
| Interquartile 25% (IQ1) | 82.4% | 82.6% |
| Interquartile 75% (IQ3) | 88.5% | 85.0% |
| Interquartile Range (IQR) | 6.1% | 2.3% |
| Standard Deviation (Sample) | 13.0% | 2.0% |
| Standard Deviation (Population) | 12.8% | 2.0% |
Similar Demographics by In Labor Force | Age 30-34
Demographics Similar to Immigrants from Morocco by In Labor Force | Age 30-34
In terms of in labor force | age 30-34, the demographic groups most similar to Immigrants from Morocco are Croatian (85.6%, a difference of 0.0%), Immigrants from Sri Lanka (85.6%, a difference of 0.010%), Immigrants from Nepal (85.6%, a difference of 0.010%), Immigrants from Sweden (85.6%, a difference of 0.020%), and Lithuanian (85.6%, a difference of 0.020%).
| Demographics | Rating | Rank | In Labor Force | Age 30-34 |
| Eastern Europeans | 99.9 /100 | #39 | Exceptional 85.7% |
| Turks | 99.9 /100 | #40 | Exceptional 85.7% |
| Immigrants | Italy | 99.9 /100 | #41 | Exceptional 85.7% |
| Zimbabweans | 99.8 /100 | #42 | Exceptional 85.6% |
| Immigrants | Lithuania | 99.8 /100 | #43 | Exceptional 85.6% |
| Immigrants | Sri Lanka | 99.8 /100 | #44 | Exceptional 85.6% |
| Immigrants | Nepal | 99.8 /100 | #45 | Exceptional 85.6% |
| Immigrants | Morocco | 99.8 /100 | #46 | Exceptional 85.6% |
| Croatians | 99.8 /100 | #47 | Exceptional 85.6% |
| Immigrants | Sweden | 99.8 /100 | #48 | Exceptional 85.6% |
| Lithuanians | 99.8 /100 | #49 | Exceptional 85.6% |
| Immigrants | Australia | 99.8 /100 | #50 | Exceptional 85.6% |
| Cape Verdeans | 99.7 /100 | #51 | Exceptional 85.6% |
| Slovenes | 99.7 /100 | #52 | Exceptional 85.6% |
| Filipinos | 99.6 /100 | #53 | Exceptional 85.5% |
Demographics Similar to Nonimmigrants by In Labor Force | Age 30-34
In terms of in labor force | age 30-34, the demographic groups most similar to Nonimmigrants are Spanish (83.5%, a difference of 0.0%), Spanish American (83.5%, a difference of 0.020%), Guamanian/Chamorro (83.5%, a difference of 0.050%), Belizean (83.5%, a difference of 0.060%), and Vietnamese (83.6%, a difference of 0.070%).
| Demographics | Rating | Rank | In Labor Force | Age 30-34 |
| Immigrants | Honduras | 0.1 /100 | #265 | Tragic 83.7% |
| Immigrants | Guatemala | 0.1 /100 | #266 | Tragic 83.7% |
| Spaniards | 0.1 /100 | #267 | Tragic 83.6% |
| Immigrants | Bangladesh | 0.1 /100 | #268 | Tragic 83.6% |
| Vietnamese | 0.1 /100 | #269 | Tragic 83.6% |
| Spanish Americans | 0.0 /100 | #270 | Tragic 83.5% |
| Spanish | 0.0 /100 | #271 | Tragic 83.5% |
| Immigrants | Nonimmigrants | 0.0 /100 | #272 | Tragic 83.5% |
| Guamanians/Chamorros | 0.0 /100 | #273 | Tragic 83.5% |
| Belizeans | 0.0 /100 | #274 | Tragic 83.5% |
| Immigrants | Grenada | 0.0 /100 | #275 | Tragic 83.5% |
| Tongans | 0.0 /100 | #276 | Tragic 83.5% |
| Delaware | 0.0 /100 | #277 | Tragic 83.5% |
| Fijians | 0.0 /100 | #278 | Tragic 83.4% |
| Immigrants | Fiji | 0.0 /100 | #279 | Tragic 83.4% |