Native Hawaiian vs Immigrants from Kuwait In Labor Force | Age 30-34
COMPARE
Native Hawaiian
Immigrants from Kuwait
In Labor Force | Age 30-34
In Labor Force | Age 30-34 Comparison
Native Hawaiians
Immigrants from Kuwait
83.0%
IN LABOR FORCE | AGE 30-34
0.0/ 100
METRIC RATING
287th/ 347
METRIC RANK
85.1%
IN LABOR FORCE | AGE 30-34
92.6/ 100
METRIC RATING
122nd/ 347
METRIC RANK
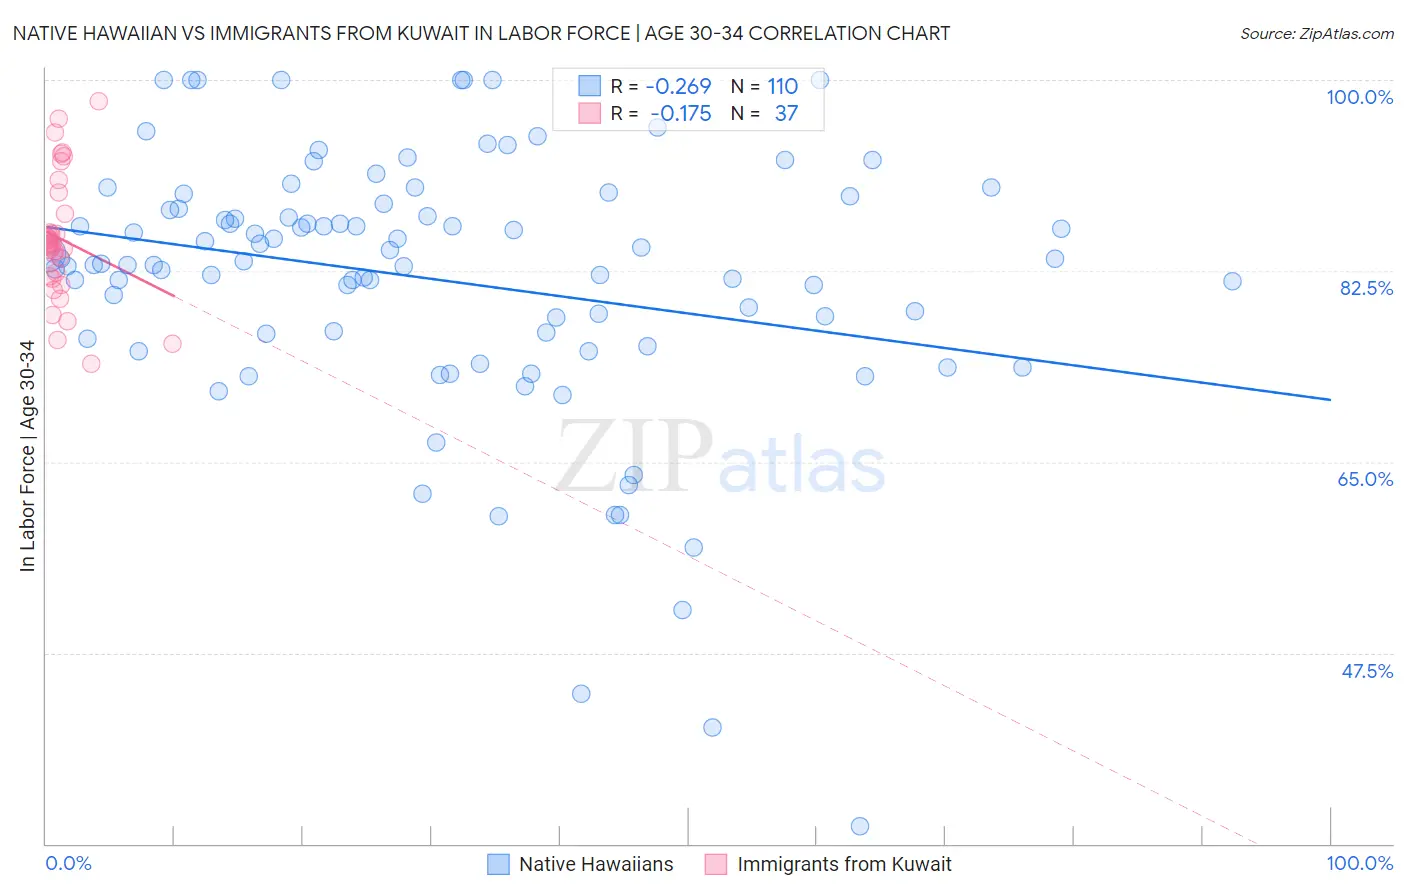
Native Hawaiian vs Immigrants from Kuwait In Labor Force | Age 30-34 Correlation Chart
The statistical analysis conducted on geographies consisting of 331,941,727 people shows a weak negative correlation between the proportion of Native Hawaiians and labor force participation rate among population between the ages 30 and 34 in the United States with a correlation coefficient (R) of -0.269 and weighted average of 83.0%. Similarly, the statistical analysis conducted on geographies consisting of 136,877,568 people shows a poor negative correlation between the proportion of Immigrants from Kuwait and labor force participation rate among population between the ages 30 and 34 in the United States with a correlation coefficient (R) of -0.175 and weighted average of 85.1%, a difference of 2.4%.
In Labor Force | Age 30-34 Correlation Summary
| Measurement | Native Hawaiian | Immigrants from Kuwait |
| Minimum | 31.6% | 74.0% |
| Maximum | 100.0% | 98.1% |
| Range | 68.4% | 24.1% |
| Mean | 81.7% | 85.4% |
| Median | 83.3% | 85.0% |
| Interquartile 25% (IQ1) | 76.7% | 81.9% |
| Interquartile 75% (IQ3) | 88.2% | 88.7% |
| Interquartile Range (IQR) | 11.5% | 6.9% |
| Standard Deviation (Sample) | 12.3% | 5.7% |
| Standard Deviation (Population) | 12.2% | 5.7% |
Similar Demographics by In Labor Force | Age 30-34
Demographics Similar to Native Hawaiians by In Labor Force | Age 30-34
In terms of in labor force | age 30-34, the demographic groups most similar to Native Hawaiians are Central American Indian (83.0%, a difference of 0.030%), Hawaiian (83.0%, a difference of 0.050%), Immigrants from Latin America (83.1%, a difference of 0.10%), Immigrants from Belize (83.2%, a difference of 0.16%), and Cree (83.2%, a difference of 0.16%).
| Demographics | Rating | Rank | In Labor Force | Age 30-34 |
| Africans | 0.0 /100 | #280 | Tragic 83.4% |
| Samoans | 0.0 /100 | #281 | Tragic 83.3% |
| Mexican American Indians | 0.0 /100 | #282 | Tragic 83.2% |
| Assyrians/Chaldeans/Syriacs | 0.0 /100 | #283 | Tragic 83.2% |
| Immigrants | Belize | 0.0 /100 | #284 | Tragic 83.2% |
| Cree | 0.0 /100 | #285 | Tragic 83.2% |
| Immigrants | Latin America | 0.0 /100 | #286 | Tragic 83.1% |
| Native Hawaiians | 0.0 /100 | #287 | Tragic 83.0% |
| Central American Indians | 0.0 /100 | #288 | Tragic 83.0% |
| Hawaiians | 0.0 /100 | #289 | Tragic 83.0% |
| Blackfeet | 0.0 /100 | #290 | Tragic 82.8% |
| Potawatomi | 0.0 /100 | #291 | Tragic 82.8% |
| Blacks/African Americans | 0.0 /100 | #292 | Tragic 82.8% |
| Nepalese | 0.0 /100 | #293 | Tragic 82.7% |
| Americans | 0.0 /100 | #294 | Tragic 82.7% |
Demographics Similar to Immigrants from Kuwait by In Labor Force | Age 30-34
In terms of in labor force | age 30-34, the demographic groups most similar to Immigrants from Kuwait are Armenian (85.0%, a difference of 0.010%), Australian (85.0%, a difference of 0.010%), Asian (85.1%, a difference of 0.020%), Immigrants from Southern Europe (85.1%, a difference of 0.020%), and Immigrants from Egypt (85.1%, a difference of 0.020%).
| Demographics | Rating | Rank | In Labor Force | Age 30-34 |
| Immigrants | South Central Asia | 94.6 /100 | #115 | Exceptional 85.1% |
| Egyptians | 94.5 /100 | #116 | Exceptional 85.1% |
| Immigrants | Denmark | 94.3 /100 | #117 | Exceptional 85.1% |
| Immigrants | Malaysia | 94.2 /100 | #118 | Exceptional 85.1% |
| Asians | 93.4 /100 | #119 | Exceptional 85.1% |
| Immigrants | Southern Europe | 93.3 /100 | #120 | Exceptional 85.1% |
| Immigrants | Egypt | 93.2 /100 | #121 | Exceptional 85.1% |
| Immigrants | Kuwait | 92.6 /100 | #122 | Exceptional 85.1% |
| Armenians | 92.2 /100 | #123 | Exceptional 85.0% |
| Australians | 92.0 /100 | #124 | Exceptional 85.0% |
| Immigrants | Jordan | 91.5 /100 | #125 | Exceptional 85.0% |
| Austrians | 90.9 /100 | #126 | Exceptional 85.0% |
| Slavs | 90.7 /100 | #127 | Exceptional 85.0% |
| Immigrants | Argentina | 90.6 /100 | #128 | Exceptional 85.0% |
| Immigrants | Western Africa | 90.2 /100 | #129 | Exceptional 85.0% |