Kiowa vs Nonimmigrants In Labor Force | Age 30-34
COMPARE
Kiowa
Nonimmigrants
In Labor Force | Age 30-34
In Labor Force | Age 30-34 Comparison
Kiowa
Nonimmigrants
79.8%
IN LABOR FORCE | AGE 30-34
0.0/ 100
METRIC RATING
332nd/ 347
METRIC RANK
83.5%
IN LABOR FORCE | AGE 30-34
0.0/ 100
METRIC RATING
272nd/ 347
METRIC RANK
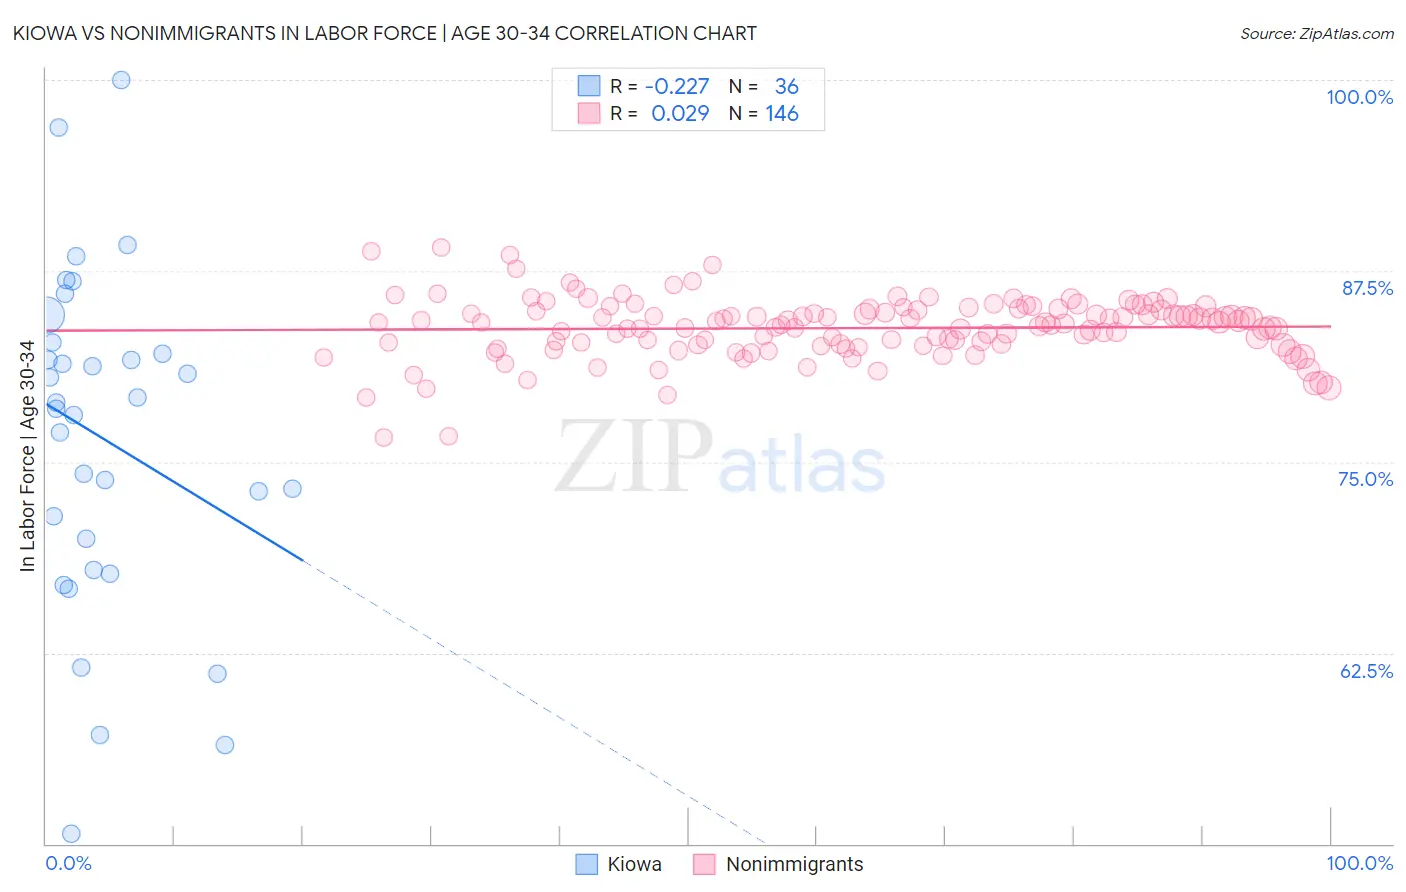
Kiowa vs Nonimmigrants In Labor Force | Age 30-34 Correlation Chart
The statistical analysis conducted on geographies consisting of 56,095,745 people shows a weak negative correlation between the proportion of Kiowa and labor force participation rate among population between the ages 30 and 34 in the United States with a correlation coefficient (R) of -0.227 and weighted average of 79.8%. Similarly, the statistical analysis conducted on geographies consisting of 582,736,501 people shows no correlation between the proportion of Nonimmigrants and labor force participation rate among population between the ages 30 and 34 in the United States with a correlation coefficient (R) of 0.029 and weighted average of 83.5%, a difference of 4.7%.
In Labor Force | Age 30-34 Correlation Summary
| Measurement | Kiowa | Nonimmigrants |
| Minimum | 50.7% | 76.6% |
| Maximum | 100.0% | 89.0% |
| Range | 49.3% | 12.4% |
| Mean | 76.5% | 83.8% |
| Median | 78.7% | 84.1% |
| Interquartile 25% (IQ1) | 69.0% | 82.6% |
| Interquartile 75% (IQ3) | 82.5% | 85.0% |
| Interquartile Range (IQR) | 13.5% | 2.3% |
| Standard Deviation (Sample) | 11.0% | 2.0% |
| Standard Deviation (Population) | 10.8% | 2.0% |
Similar Demographics by In Labor Force | Age 30-34
Demographics Similar to Kiowa by In Labor Force | Age 30-34
In terms of in labor force | age 30-34, the demographic groups most similar to Kiowa are Houma (79.9%, a difference of 0.11%), Inupiat (79.7%, a difference of 0.12%), Pueblo (80.0%, a difference of 0.28%), Creek (80.4%, a difference of 0.68%), and Sioux (80.4%, a difference of 0.69%).
| Demographics | Rating | Rank | In Labor Force | Age 30-34 |
| Dutch West Indians | 0.0 /100 | #325 | Tragic 81.0% |
| Seminole | 0.0 /100 | #326 | Tragic 80.8% |
| Colville | 0.0 /100 | #327 | Tragic 80.7% |
| Sioux | 0.0 /100 | #328 | Tragic 80.4% |
| Creek | 0.0 /100 | #329 | Tragic 80.4% |
| Pueblo | 0.0 /100 | #330 | Tragic 80.0% |
| Houma | 0.0 /100 | #331 | Tragic 79.9% |
| Kiowa | 0.0 /100 | #332 | Tragic 79.8% |
| Inupiat | 0.0 /100 | #333 | Tragic 79.7% |
| Hopi | 0.0 /100 | #334 | Tragic 79.3% |
| Marshallese | 0.0 /100 | #335 | Tragic 79.2% |
| Natives/Alaskans | 0.0 /100 | #336 | Tragic 79.2% |
| Yakama | 0.0 /100 | #337 | Tragic 79.1% |
| Pima | 0.0 /100 | #338 | Tragic 79.0% |
| Apache | 0.0 /100 | #339 | Tragic 79.0% |
Demographics Similar to Nonimmigrants by In Labor Force | Age 30-34
In terms of in labor force | age 30-34, the demographic groups most similar to Nonimmigrants are Spanish (83.5%, a difference of 0.0%), Spanish American (83.5%, a difference of 0.020%), Guamanian/Chamorro (83.5%, a difference of 0.050%), Belizean (83.5%, a difference of 0.060%), and Vietnamese (83.6%, a difference of 0.070%).
| Demographics | Rating | Rank | In Labor Force | Age 30-34 |
| Immigrants | Honduras | 0.1 /100 | #265 | Tragic 83.7% |
| Immigrants | Guatemala | 0.1 /100 | #266 | Tragic 83.7% |
| Spaniards | 0.1 /100 | #267 | Tragic 83.6% |
| Immigrants | Bangladesh | 0.1 /100 | #268 | Tragic 83.6% |
| Vietnamese | 0.1 /100 | #269 | Tragic 83.6% |
| Spanish Americans | 0.0 /100 | #270 | Tragic 83.5% |
| Spanish | 0.0 /100 | #271 | Tragic 83.5% |
| Immigrants | Nonimmigrants | 0.0 /100 | #272 | Tragic 83.5% |
| Guamanians/Chamorros | 0.0 /100 | #273 | Tragic 83.5% |
| Belizeans | 0.0 /100 | #274 | Tragic 83.5% |
| Immigrants | Grenada | 0.0 /100 | #275 | Tragic 83.5% |
| Tongans | 0.0 /100 | #276 | Tragic 83.5% |
| Delaware | 0.0 /100 | #277 | Tragic 83.5% |
| Fijians | 0.0 /100 | #278 | Tragic 83.4% |
| Immigrants | Fiji | 0.0 /100 | #279 | Tragic 83.4% |