Mexican vs Immigrants from Senegal In Labor Force | Age > 16
COMPARE
Mexican
Immigrants from Senegal
In Labor Force | Age > 16
In Labor Force | Age > 16 Comparison
Mexicans
Immigrants from Senegal
64.1%
IN LABOR FORCE | AGE > 16
0.3/ 100
METRIC RATING
275th/ 347
METRIC RANK
66.4%
IN LABOR FORCE | AGE > 16
99.9/ 100
METRIC RATING
56th/ 347
METRIC RANK
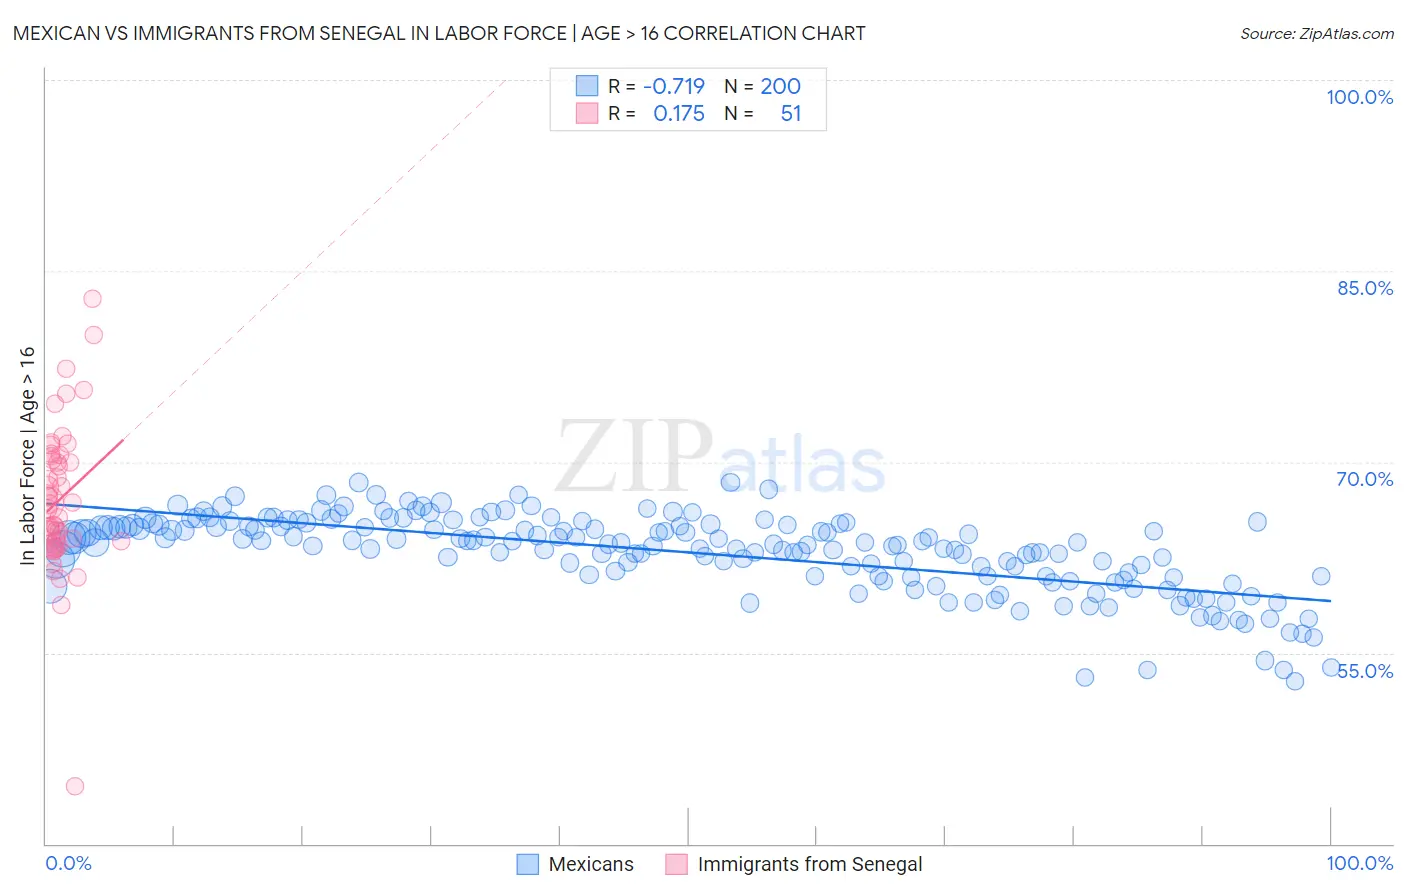
Mexican vs Immigrants from Senegal In Labor Force | Age > 16 Correlation Chart
The statistical analysis conducted on geographies consisting of 565,326,570 people shows a strong negative correlation between the proportion of Mexicans and labor force participation rate among population ages 16 and over in the United States with a correlation coefficient (R) of -0.719 and weighted average of 64.1%. Similarly, the statistical analysis conducted on geographies consisting of 90,129,295 people shows a poor positive correlation between the proportion of Immigrants from Senegal and labor force participation rate among population ages 16 and over in the United States with a correlation coefficient (R) of 0.175 and weighted average of 66.4%, a difference of 3.7%.
In Labor Force | Age > 16 Correlation Summary
| Measurement | Mexican | Immigrants from Senegal |
| Minimum | 52.8% | 44.5% |
| Maximum | 68.4% | 82.8% |
| Range | 15.6% | 38.3% |
| Mean | 62.9% | 67.1% |
| Median | 63.7% | 66.7% |
| Interquartile 25% (IQ1) | 61.0% | 63.6% |
| Interquartile 75% (IQ3) | 65.0% | 70.4% |
| Interquartile Range (IQR) | 4.0% | 6.9% |
| Standard Deviation (Sample) | 3.1% | 5.9% |
| Standard Deviation (Population) | 3.1% | 5.9% |
Similar Demographics by In Labor Force | Age > 16
Demographics Similar to Mexicans by In Labor Force | Age > 16
In terms of in labor force | age > 16, the demographic groups most similar to Mexicans are Immigrants from Cuba (64.1%, a difference of 0.0%), French American Indian (64.1%, a difference of 0.0%), Native Hawaiian (64.1%, a difference of 0.020%), Hmong (64.1%, a difference of 0.020%), and Immigrants from Bahamas (64.0%, a difference of 0.030%).
| Demographics | Rating | Rank | In Labor Force | Age > 16 |
| Spaniards | 0.5 /100 | #268 | Tragic 64.1% |
| Irish | 0.4 /100 | #269 | Tragic 64.1% |
| Guyanese | 0.4 /100 | #270 | Tragic 64.1% |
| Dominicans | 0.4 /100 | #271 | Tragic 64.1% |
| Native Hawaiians | 0.3 /100 | #272 | Tragic 64.1% |
| Hmong | 0.3 /100 | #273 | Tragic 64.1% |
| Immigrants | Cuba | 0.3 /100 | #274 | Tragic 64.1% |
| Mexicans | 0.3 /100 | #275 | Tragic 64.1% |
| French American Indians | 0.3 /100 | #276 | Tragic 64.1% |
| Immigrants | Bahamas | 0.3 /100 | #277 | Tragic 64.0% |
| Assyrians/Chaldeans/Syriacs | 0.3 /100 | #278 | Tragic 64.0% |
| Welsh | 0.2 /100 | #279 | Tragic 64.0% |
| Immigrants | St. Vincent and the Grenadines | 0.2 /100 | #280 | Tragic 64.0% |
| French Canadians | 0.2 /100 | #281 | Tragic 64.0% |
| Immigrants | Guyana | 0.2 /100 | #282 | Tragic 64.0% |
Demographics Similar to Immigrants from Senegal by In Labor Force | Age > 16
In terms of in labor force | age > 16, the demographic groups most similar to Immigrants from Senegal are Bulgarian (66.4%, a difference of 0.010%), Immigrants from Venezuela (66.4%, a difference of 0.030%), Immigrants from Bosnia and Herzegovina (66.5%, a difference of 0.080%), Immigrants from Sri Lanka (66.5%, a difference of 0.11%), and Immigrants from Saudi Arabia (66.3%, a difference of 0.11%).
| Demographics | Rating | Rank | In Labor Force | Age > 16 |
| Immigrants | Northern Africa | 100.0 /100 | #49 | Exceptional 66.6% |
| Cape Verdeans | 100.0 /100 | #50 | Exceptional 66.6% |
| Immigrants | Kuwait | 100.0 /100 | #51 | Exceptional 66.5% |
| Paraguayans | 99.9 /100 | #52 | Exceptional 66.5% |
| Immigrants | Sri Lanka | 99.9 /100 | #53 | Exceptional 66.5% |
| Immigrants | Bosnia and Herzegovina | 99.9 /100 | #54 | Exceptional 66.5% |
| Immigrants | Venezuela | 99.9 /100 | #55 | Exceptional 66.4% |
| Immigrants | Senegal | 99.9 /100 | #56 | Exceptional 66.4% |
| Bulgarians | 99.9 /100 | #57 | Exceptional 66.4% |
| Immigrants | Saudi Arabia | 99.9 /100 | #58 | Exceptional 66.3% |
| Immigrants | Turkey | 99.9 /100 | #59 | Exceptional 66.3% |
| Immigrants | Peru | 99.8 /100 | #60 | Exceptional 66.3% |
| Immigrants | Burma/Myanmar | 99.8 /100 | #61 | Exceptional 66.3% |
| Indonesians | 99.8 /100 | #62 | Exceptional 66.3% |
| Venezuelans | 99.8 /100 | #63 | Exceptional 66.3% |