Mexican vs Yaqui In Labor Force | Age > 16
COMPARE
Mexican
Yaqui
In Labor Force | Age > 16
In Labor Force | Age > 16 Comparison
Mexicans
Yaqui
64.1%
IN LABOR FORCE | AGE > 16
0.3/ 100
METRIC RATING
275th/ 347
METRIC RANK
63.0%
IN LABOR FORCE | AGE > 16
0.0/ 100
METRIC RATING
314th/ 347
METRIC RANK
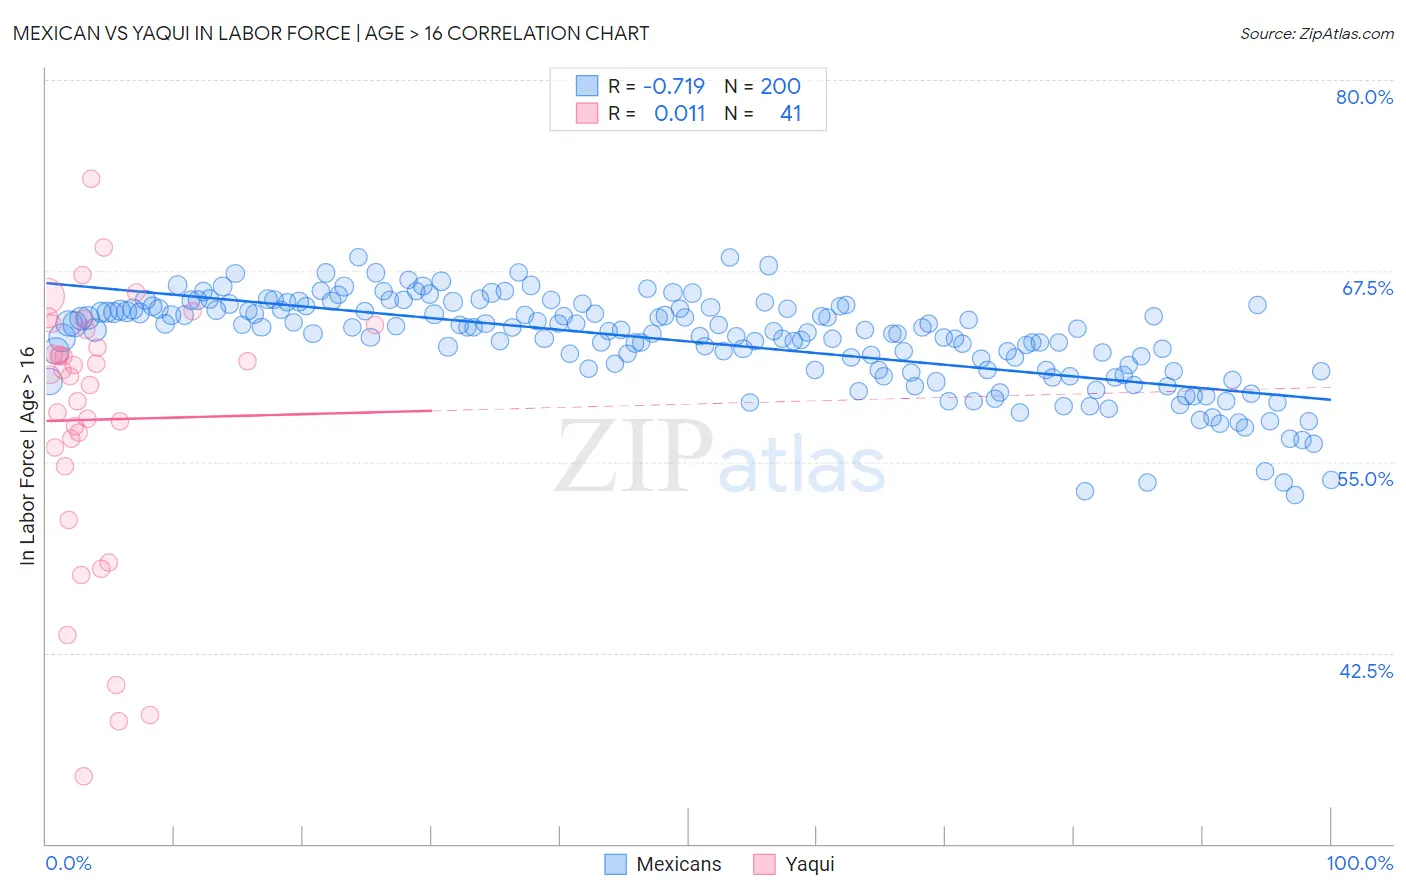
Mexican vs Yaqui In Labor Force | Age > 16 Correlation Chart
The statistical analysis conducted on geographies consisting of 565,326,570 people shows a strong negative correlation between the proportion of Mexicans and labor force participation rate among population ages 16 and over in the United States with a correlation coefficient (R) of -0.719 and weighted average of 64.1%. Similarly, the statistical analysis conducted on geographies consisting of 107,721,250 people shows no correlation between the proportion of Yaqui and labor force participation rate among population ages 16 and over in the United States with a correlation coefficient (R) of 0.011 and weighted average of 63.0%, a difference of 1.6%.
In Labor Force | Age > 16 Correlation Summary
| Measurement | Mexican | Yaqui |
| Minimum | 52.8% | 34.4% |
| Maximum | 68.4% | 73.5% |
| Range | 15.6% | 39.1% |
| Mean | 62.9% | 57.8% |
| Median | 63.7% | 60.7% |
| Interquartile 25% (IQ1) | 61.0% | 55.3% |
| Interquartile 75% (IQ3) | 65.0% | 63.8% |
| Interquartile Range (IQR) | 4.0% | 8.5% |
| Standard Deviation (Sample) | 3.1% | 8.9% |
| Standard Deviation (Population) | 3.1% | 8.8% |
Similar Demographics by In Labor Force | Age > 16
Demographics Similar to Mexicans by In Labor Force | Age > 16
In terms of in labor force | age > 16, the demographic groups most similar to Mexicans are Immigrants from Cuba (64.1%, a difference of 0.0%), French American Indian (64.1%, a difference of 0.0%), Native Hawaiian (64.1%, a difference of 0.020%), Hmong (64.1%, a difference of 0.020%), and Immigrants from Bahamas (64.0%, a difference of 0.030%).
| Demographics | Rating | Rank | In Labor Force | Age > 16 |
| Spaniards | 0.5 /100 | #268 | Tragic 64.1% |
| Irish | 0.4 /100 | #269 | Tragic 64.1% |
| Guyanese | 0.4 /100 | #270 | Tragic 64.1% |
| Dominicans | 0.4 /100 | #271 | Tragic 64.1% |
| Native Hawaiians | 0.3 /100 | #272 | Tragic 64.1% |
| Hmong | 0.3 /100 | #273 | Tragic 64.1% |
| Immigrants | Cuba | 0.3 /100 | #274 | Tragic 64.1% |
| Mexicans | 0.3 /100 | #275 | Tragic 64.1% |
| French American Indians | 0.3 /100 | #276 | Tragic 64.1% |
| Immigrants | Bahamas | 0.3 /100 | #277 | Tragic 64.0% |
| Assyrians/Chaldeans/Syriacs | 0.3 /100 | #278 | Tragic 64.0% |
| Welsh | 0.2 /100 | #279 | Tragic 64.0% |
| Immigrants | St. Vincent and the Grenadines | 0.2 /100 | #280 | Tragic 64.0% |
| French Canadians | 0.2 /100 | #281 | Tragic 64.0% |
| Immigrants | Guyana | 0.2 /100 | #282 | Tragic 64.0% |
Demographics Similar to Yaqui by In Labor Force | Age > 16
In terms of in labor force | age > 16, the demographic groups most similar to Yaqui are Chippewa (63.1%, a difference of 0.10%), Iroquois (63.2%, a difference of 0.23%), Blackfeet (63.2%, a difference of 0.29%), Shoshone (63.2%, a difference of 0.30%), and Potawatomi (62.8%, a difference of 0.35%).
| Demographics | Rating | Rank | In Labor Force | Age > 16 |
| Central American Indians | 0.0 /100 | #307 | Tragic 63.4% |
| Pennsylvania Germans | 0.0 /100 | #308 | Tragic 63.4% |
| Scotch-Irish | 0.0 /100 | #309 | Tragic 63.3% |
| Shoshone | 0.0 /100 | #310 | Tragic 63.2% |
| Blackfeet | 0.0 /100 | #311 | Tragic 63.2% |
| Iroquois | 0.0 /100 | #312 | Tragic 63.2% |
| Chippewa | 0.0 /100 | #313 | Tragic 63.1% |
| Yaqui | 0.0 /100 | #314 | Tragic 63.0% |
| Potawatomi | 0.0 /100 | #315 | Tragic 62.8% |
| Yup'ik | 0.0 /100 | #316 | Tragic 62.7% |
| Kiowa | 0.0 /100 | #317 | Tragic 62.4% |
| Chickasaw | 0.0 /100 | #318 | Tragic 62.3% |
| Arapaho | 0.0 /100 | #319 | Tragic 62.1% |
| Yakama | 0.0 /100 | #320 | Tragic 62.1% |
| Americans | 0.0 /100 | #321 | Tragic 62.1% |