Mexican vs Eastern European In Labor Force | Age > 16
COMPARE
Mexican
Eastern European
In Labor Force | Age > 16
In Labor Force | Age > 16 Comparison
Mexicans
Eastern Europeans
64.1%
IN LABOR FORCE | AGE > 16
0.3/ 100
METRIC RATING
275th/ 347
METRIC RANK
65.1%
IN LABOR FORCE | AGE > 16
46.2/ 100
METRIC RATING
177th/ 347
METRIC RANK
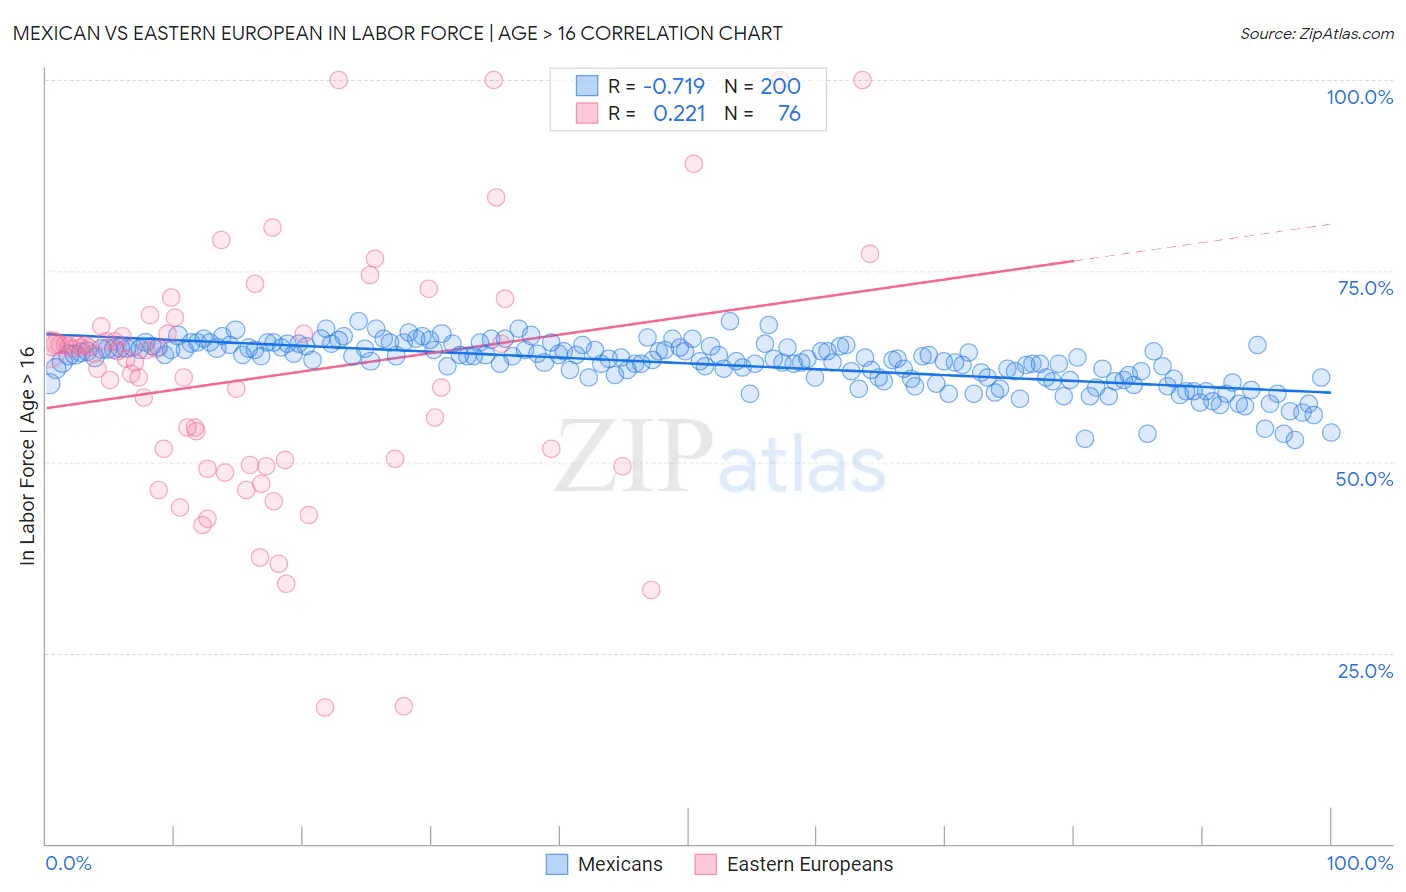
Mexican vs Eastern European In Labor Force | Age > 16 Correlation Chart
The statistical analysis conducted on geographies consisting of 565,326,570 people shows a strong negative correlation between the proportion of Mexicans and labor force participation rate among population ages 16 and over in the United States with a correlation coefficient (R) of -0.719 and weighted average of 64.1%. Similarly, the statistical analysis conducted on geographies consisting of 461,261,446 people shows a weak positive correlation between the proportion of Eastern Europeans and labor force participation rate among population ages 16 and over in the United States with a correlation coefficient (R) of 0.221 and weighted average of 65.1%, a difference of 1.6%.
In Labor Force | Age > 16 Correlation Summary
| Measurement | Mexican | Eastern European |
| Minimum | 52.8% | 17.9% |
| Maximum | 68.4% | 100.0% |
| Range | 15.6% | 82.1% |
| Mean | 62.9% | 61.1% |
| Median | 63.7% | 64.3% |
| Interquartile 25% (IQ1) | 61.0% | 49.9% |
| Interquartile 75% (IQ3) | 65.0% | 66.8% |
| Interquartile Range (IQR) | 4.0% | 16.9% |
| Standard Deviation (Sample) | 3.1% | 16.2% |
| Standard Deviation (Population) | 3.1% | 16.1% |
Similar Demographics by In Labor Force | Age > 16
Demographics Similar to Mexicans by In Labor Force | Age > 16
In terms of in labor force | age > 16, the demographic groups most similar to Mexicans are Immigrants from Cuba (64.1%, a difference of 0.0%), French American Indian (64.1%, a difference of 0.0%), Native Hawaiian (64.1%, a difference of 0.020%), Hmong (64.1%, a difference of 0.020%), and Immigrants from Bahamas (64.0%, a difference of 0.030%).
| Demographics | Rating | Rank | In Labor Force | Age > 16 |
| Spaniards | 0.5 /100 | #268 | Tragic 64.1% |
| Irish | 0.4 /100 | #269 | Tragic 64.1% |
| Guyanese | 0.4 /100 | #270 | Tragic 64.1% |
| Dominicans | 0.4 /100 | #271 | Tragic 64.1% |
| Native Hawaiians | 0.3 /100 | #272 | Tragic 64.1% |
| Hmong | 0.3 /100 | #273 | Tragic 64.1% |
| Immigrants | Cuba | 0.3 /100 | #274 | Tragic 64.1% |
| Mexicans | 0.3 /100 | #275 | Tragic 64.1% |
| French American Indians | 0.3 /100 | #276 | Tragic 64.1% |
| Immigrants | Bahamas | 0.3 /100 | #277 | Tragic 64.0% |
| Assyrians/Chaldeans/Syriacs | 0.3 /100 | #278 | Tragic 64.0% |
| Welsh | 0.2 /100 | #279 | Tragic 64.0% |
| Immigrants | St. Vincent and the Grenadines | 0.2 /100 | #280 | Tragic 64.0% |
| French Canadians | 0.2 /100 | #281 | Tragic 64.0% |
| Immigrants | Guyana | 0.2 /100 | #282 | Tragic 64.0% |
Demographics Similar to Eastern Europeans by In Labor Force | Age > 16
In terms of in labor force | age > 16, the demographic groups most similar to Eastern Europeans are Swedish (65.1%, a difference of 0.010%), Trinidadian and Tobagonian (65.1%, a difference of 0.010%), Immigrants from Haiti (65.1%, a difference of 0.030%), Macedonian (65.1%, a difference of 0.040%), and Nicaraguan (65.1%, a difference of 0.040%).
| Demographics | Rating | Rank | In Labor Force | Age > 16 |
| Immigrants | Israel | 61.7 /100 | #170 | Good 65.2% |
| Israelis | 61.6 /100 | #171 | Good 65.2% |
| Immigrants | Sweden | 61.3 /100 | #172 | Good 65.2% |
| Immigrants | Ukraine | 53.7 /100 | #173 | Average 65.1% |
| Macedonians | 50.0 /100 | #174 | Average 65.1% |
| Nicaraguans | 49.7 /100 | #175 | Average 65.1% |
| Swedes | 47.4 /100 | #176 | Average 65.1% |
| Eastern Europeans | 46.2 /100 | #177 | Average 65.1% |
| Trinidadians and Tobagonians | 45.2 /100 | #178 | Average 65.1% |
| Immigrants | Haiti | 43.3 /100 | #179 | Average 65.1% |
| Immigrants | Latvia | 42.9 /100 | #180 | Average 65.1% |
| Immigrants | Panama | 42.4 /100 | #181 | Average 65.1% |
| Immigrants | Nicaragua | 41.1 /100 | #182 | Average 65.1% |
| Soviet Union | 40.5 /100 | #183 | Average 65.0% |
| Carpatho Rusyns | 40.0 /100 | #184 | Average 65.0% |