Mexican vs Immigrants from Caribbean In Labor Force | Age 20-24
COMPARE
Mexican
Immigrants from Caribbean
In Labor Force | Age 20-24
In Labor Force | Age 20-24 Comparison
Mexicans
Immigrants from Caribbean
75.1%
IN LABOR FORCE | AGE 20-24
52.1/ 100
METRIC RATING
170th/ 347
METRIC RANK
71.9%
IN LABOR FORCE | AGE 20-24
0.0/ 100
METRIC RATING
312th/ 347
METRIC RANK
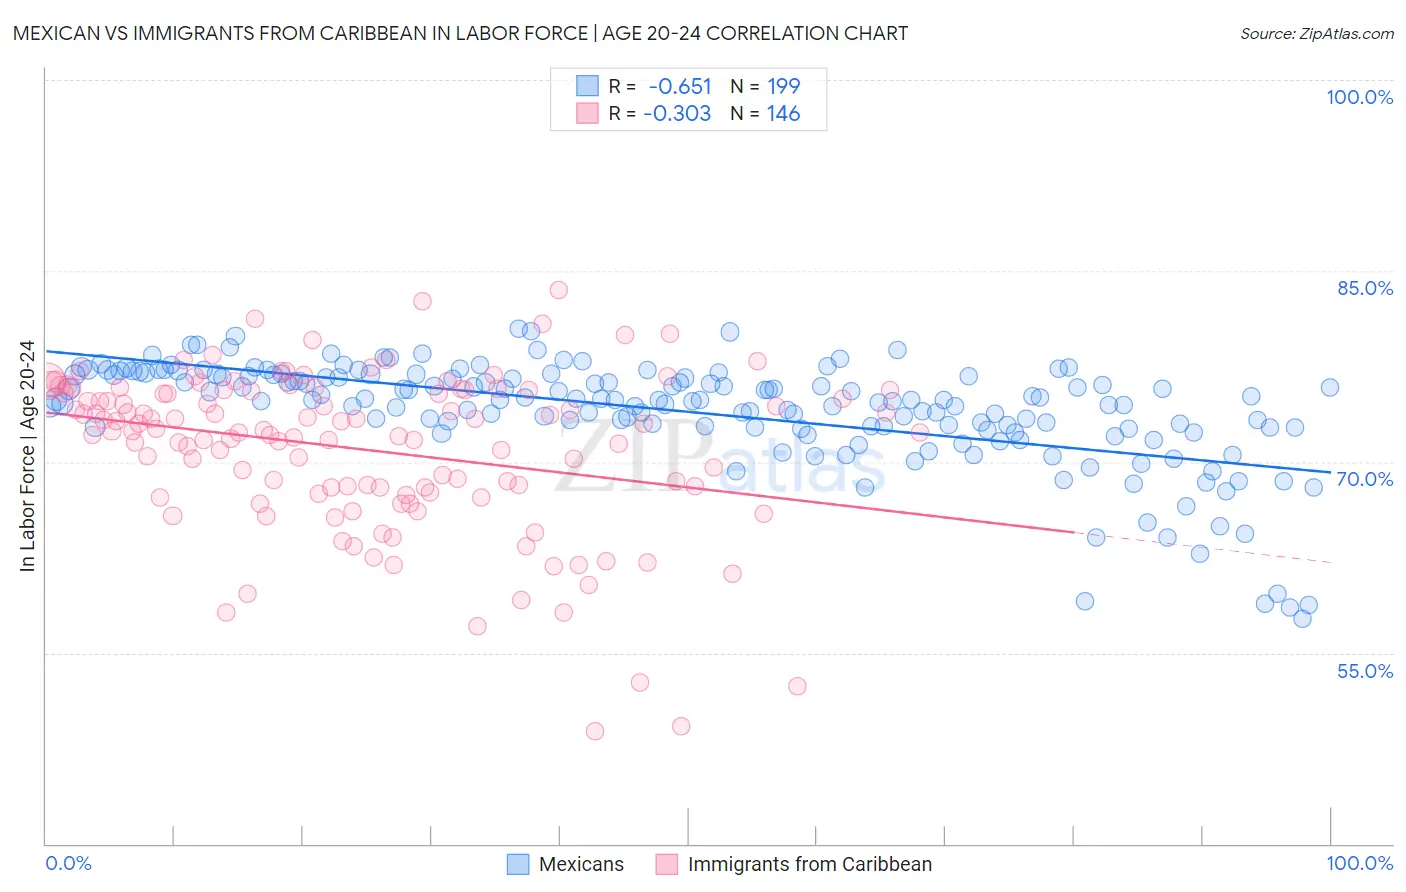
Mexican vs Immigrants from Caribbean In Labor Force | Age 20-24 Correlation Chart
The statistical analysis conducted on geographies consisting of 564,063,434 people shows a significant negative correlation between the proportion of Mexicans and labor force participation rate among population between the ages 20 and 24 in the United States with a correlation coefficient (R) of -0.651 and weighted average of 75.1%. Similarly, the statistical analysis conducted on geographies consisting of 449,795,737 people shows a mild negative correlation between the proportion of Immigrants from Caribbean and labor force participation rate among population between the ages 20 and 24 in the United States with a correlation coefficient (R) of -0.303 and weighted average of 71.9%, a difference of 4.4%.
In Labor Force | Age 20-24 Correlation Summary
| Measurement | Mexican | Immigrants from Caribbean |
| Minimum | 57.7% | 48.8% |
| Maximum | 80.4% | 83.5% |
| Range | 22.8% | 34.7% |
| Mean | 74.0% | 71.0% |
| Median | 74.9% | 72.4% |
| Interquartile 25% (IQ1) | 72.7% | 67.6% |
| Interquartile 75% (IQ3) | 76.8% | 75.6% |
| Interquartile Range (IQR) | 4.1% | 8.0% |
| Standard Deviation (Sample) | 4.2% | 6.3% |
| Standard Deviation (Population) | 4.2% | 6.3% |
Similar Demographics by In Labor Force | Age 20-24
Demographics Similar to Mexicans by In Labor Force | Age 20-24
In terms of in labor force | age 20-24, the demographic groups most similar to Mexicans are Cajun (75.1%, a difference of 0.010%), Yakama (75.1%, a difference of 0.020%), Immigrants from Croatia (75.1%, a difference of 0.030%), South African (75.0%, a difference of 0.030%), and Syrian (75.0%, a difference of 0.040%).
| Demographics | Rating | Rank | In Labor Force | Age 20-24 |
| Costa Ricans | 64.2 /100 | #163 | Good 75.2% |
| Bolivians | 64.0 /100 | #164 | Good 75.2% |
| Afghans | 63.5 /100 | #165 | Good 75.2% |
| Cambodians | 60.5 /100 | #166 | Good 75.2% |
| Immigrants | South Eastern Asia | 57.5 /100 | #167 | Average 75.1% |
| Immigrants | Western Africa | 56.7 /100 | #168 | Average 75.1% |
| Immigrants | Philippines | 55.8 /100 | #169 | Average 75.1% |
| Mexicans | 52.1 /100 | #170 | Average 75.1% |
| Cajuns | 51.1 /100 | #171 | Average 75.1% |
| Yakama | 50.8 /100 | #172 | Average 75.1% |
| Immigrants | Croatia | 50.2 /100 | #173 | Average 75.1% |
| South Africans | 50.0 /100 | #174 | Average 75.0% |
| Syrians | 49.5 /100 | #175 | Average 75.0% |
| Central Americans | 48.7 /100 | #176 | Average 75.0% |
| Immigrants | Mexico | 47.8 /100 | #177 | Average 75.0% |
Demographics Similar to Immigrants from Caribbean by In Labor Force | Age 20-24
In terms of in labor force | age 20-24, the demographic groups most similar to Immigrants from Caribbean are Immigrants from Dominica (71.9%, a difference of 0.050%), Indian (Asian) (71.9%, a difference of 0.060%), Apache (72.0%, a difference of 0.070%), Immigrants from Cuba (72.0%, a difference of 0.080%), and Immigrants from Iran (71.8%, a difference of 0.14%).
| Demographics | Rating | Rank | In Labor Force | Age 20-24 |
| Immigrants | Singapore | 0.0 /100 | #305 | Tragic 72.4% |
| Immigrants | Jamaica | 0.0 /100 | #306 | Tragic 72.4% |
| Immigrants | Ecuador | 0.0 /100 | #307 | Tragic 72.3% |
| Soviet Union | 0.0 /100 | #308 | Tragic 72.3% |
| Tsimshian | 0.0 /100 | #309 | Tragic 72.3% |
| Immigrants | Cuba | 0.0 /100 | #310 | Tragic 72.0% |
| Apache | 0.0 /100 | #311 | Tragic 72.0% |
| Immigrants | Caribbean | 0.0 /100 | #312 | Tragic 71.9% |
| Immigrants | Dominica | 0.0 /100 | #313 | Tragic 71.9% |
| Indians (Asian) | 0.0 /100 | #314 | Tragic 71.9% |
| Immigrants | Iran | 0.0 /100 | #315 | Tragic 71.8% |
| Immigrants | Eastern Asia | 0.0 /100 | #316 | Tragic 71.8% |
| Immigrants | Armenia | 0.0 /100 | #317 | Tragic 71.7% |
| Immigrants | Hong Kong | 0.0 /100 | #318 | Tragic 71.6% |
| Immigrants | Israel | 0.0 /100 | #319 | Tragic 71.6% |