Mexican vs Immigrants from Caribbean Average Family Size
COMPARE
Mexican
Immigrants from Caribbean
Average Family Size
Average Family Size Comparison
Mexicans
Immigrants from Caribbean
3.48
AVERAGE FAMILY SIZE
100.0/ 100
METRIC RATING
19th/ 347
METRIC RANK
3.33
AVERAGE FAMILY SIZE
99.9/ 100
METRIC RATING
72nd/ 347
METRIC RANK
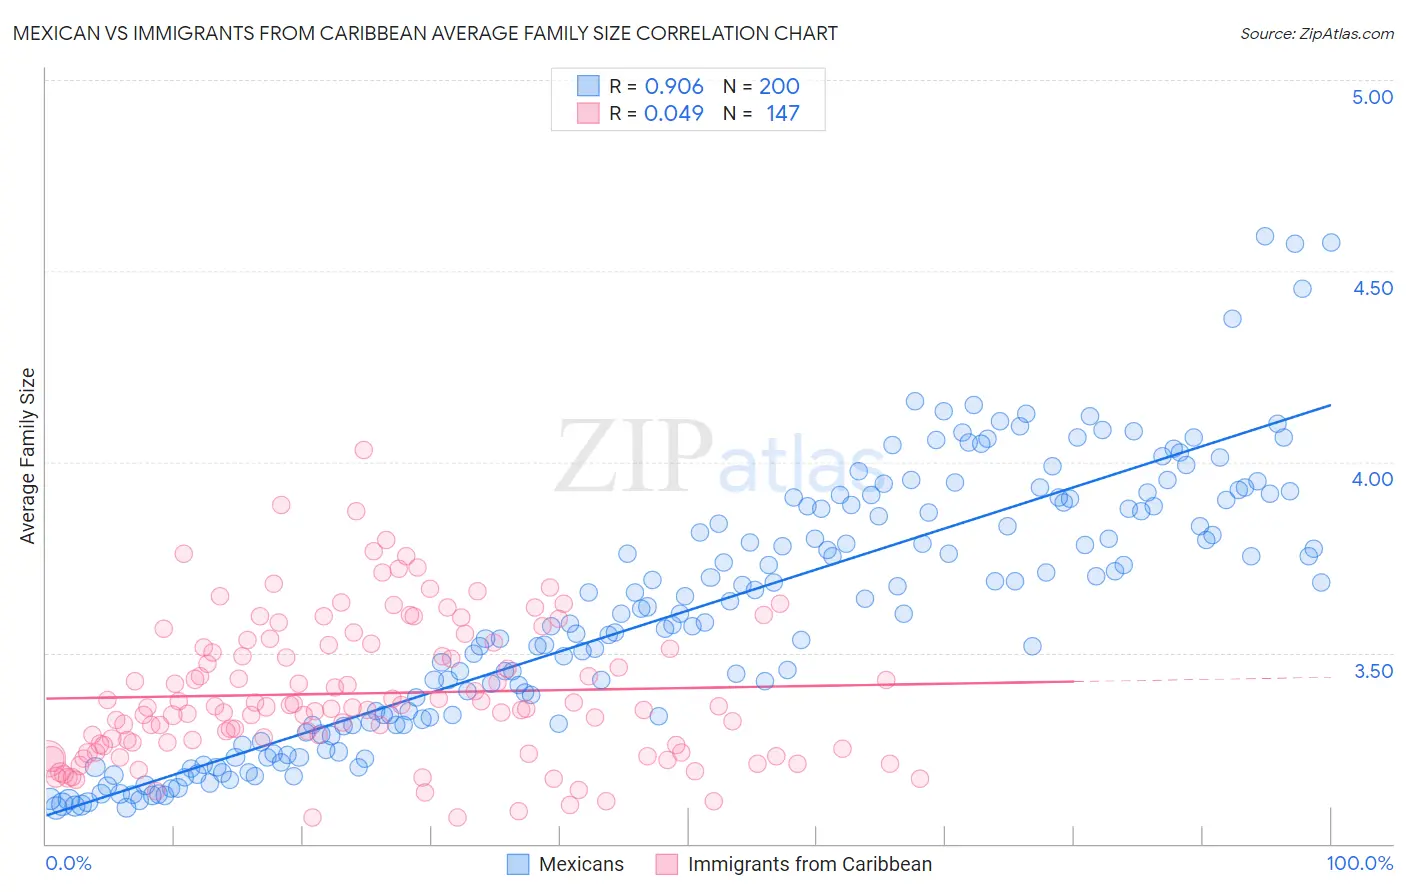
Mexican vs Immigrants from Caribbean Average Family Size Correlation Chart
The statistical analysis conducted on geographies consisting of 564,667,700 people shows a near-perfect positive correlation between the proportion of Mexicans and average family size in the United States with a correlation coefficient (R) of 0.906 and weighted average of 3.48. Similarly, the statistical analysis conducted on geographies consisting of 449,692,212 people shows no correlation between the proportion of Immigrants from Caribbean and average family size in the United States with a correlation coefficient (R) of 0.049 and weighted average of 3.33, a difference of 4.5%.
Average Family Size Correlation Summary
| Measurement | Mexican | Immigrants from Caribbean |
| Minimum | 3.09 | 3.07 |
| Maximum | 4.59 | 4.03 |
| Range | 1.50 | 0.96 |
| Mean | 3.61 | 3.39 |
| Median | 3.60 | 3.36 |
| Interquartile 25% (IQ1) | 3.31 | 3.26 |
| Interquartile 75% (IQ3) | 3.89 | 3.52 |
| Interquartile Range (IQR) | 0.58 | 0.27 |
| Standard Deviation (Sample) | 0.34 | 0.19 |
| Standard Deviation (Population) | 0.34 | 0.19 |
Similar Demographics by Average Family Size
Demographics Similar to Mexicans by Average Family Size
In terms of average family size, the demographic groups most similar to Mexicans are Cheyenne (3.47, a difference of 0.040%), Salvadoran (3.48, a difference of 0.070%), Yuman (3.47, a difference of 0.30%), Immigrants from El Salvador (3.49, a difference of 0.32%), and Apache (3.46, a difference of 0.35%).
| Demographics | Rating | Rank | Average Family Size |
| Immigrants | Mexico | 100.0 /100 | #12 | Exceptional 3.52 |
| Sioux | 100.0 /100 | #13 | Exceptional 3.52 |
| Immigrants | Central America | 100.0 /100 | #14 | Exceptional 3.49 |
| Tongans | 100.0 /100 | #15 | Exceptional 3.49 |
| Ute | 100.0 /100 | #16 | Exceptional 3.49 |
| Immigrants | El Salvador | 100.0 /100 | #17 | Exceptional 3.49 |
| Salvadorans | 100.0 /100 | #18 | Exceptional 3.48 |
| Mexicans | 100.0 /100 | #19 | Exceptional 3.48 |
| Cheyenne | 100.0 /100 | #20 | Exceptional 3.47 |
| Yuman | 100.0 /100 | #21 | Exceptional 3.47 |
| Apache | 100.0 /100 | #22 | Exceptional 3.46 |
| Immigrants | Fiji | 100.0 /100 | #23 | Exceptional 3.45 |
| Natives/Alaskans | 100.0 /100 | #24 | Exceptional 3.45 |
| Yakama | 100.0 /100 | #25 | Exceptional 3.45 |
| Native Hawaiians | 100.0 /100 | #26 | Exceptional 3.43 |
Demographics Similar to Immigrants from Caribbean by Average Family Size
In terms of average family size, the demographic groups most similar to Immigrants from Caribbean are Yaqui (3.32, a difference of 0.030%), Immigrants from Sierra Leone (3.32, a difference of 0.050%), Immigrants from West Indies (3.33, a difference of 0.070%), Immigrants from Trinidad and Tobago (3.33, a difference of 0.080%), and Immigrants from Barbados (3.32, a difference of 0.090%).
| Demographics | Rating | Rank | Average Family Size |
| Immigrants | Laos | 99.9 /100 | #65 | Exceptional 3.34 |
| Immigrants | St. Vincent and the Grenadines | 99.9 /100 | #66 | Exceptional 3.34 |
| Immigrants | Jamaica | 99.9 /100 | #67 | Exceptional 3.33 |
| Immigrants | Cambodia | 99.9 /100 | #68 | Exceptional 3.33 |
| Immigrants | Immigrants | 99.9 /100 | #69 | Exceptional 3.33 |
| Immigrants | Trinidad and Tobago | 99.9 /100 | #70 | Exceptional 3.33 |
| Immigrants | West Indies | 99.9 /100 | #71 | Exceptional 3.33 |
| Immigrants | Caribbean | 99.9 /100 | #72 | Exceptional 3.33 |
| Yaqui | 99.9 /100 | #73 | Exceptional 3.32 |
| Immigrants | Sierra Leone | 99.9 /100 | #74 | Exceptional 3.32 |
| Immigrants | Barbados | 99.8 /100 | #75 | Exceptional 3.32 |
| Trinidadians and Tobagonians | 99.8 /100 | #76 | Exceptional 3.32 |
| Immigrants | Ecuador | 99.8 /100 | #77 | Exceptional 3.32 |
| Immigrants | Micronesia | 99.8 /100 | #78 | Exceptional 3.32 |
| British West Indians | 99.8 /100 | #79 | Exceptional 3.32 |