Mexican vs Immigrants from China In Labor Force | Age 20-24
COMPARE
Mexican
Immigrants from China
In Labor Force | Age 20-24
In Labor Force | Age 20-24 Comparison
Mexicans
Immigrants from China
75.1%
IN LABOR FORCE | AGE 20-24
52.1/ 100
METRIC RATING
170th/ 347
METRIC RANK
71.1%
IN LABOR FORCE | AGE 20-24
0.0/ 100
METRIC RATING
328th/ 347
METRIC RANK
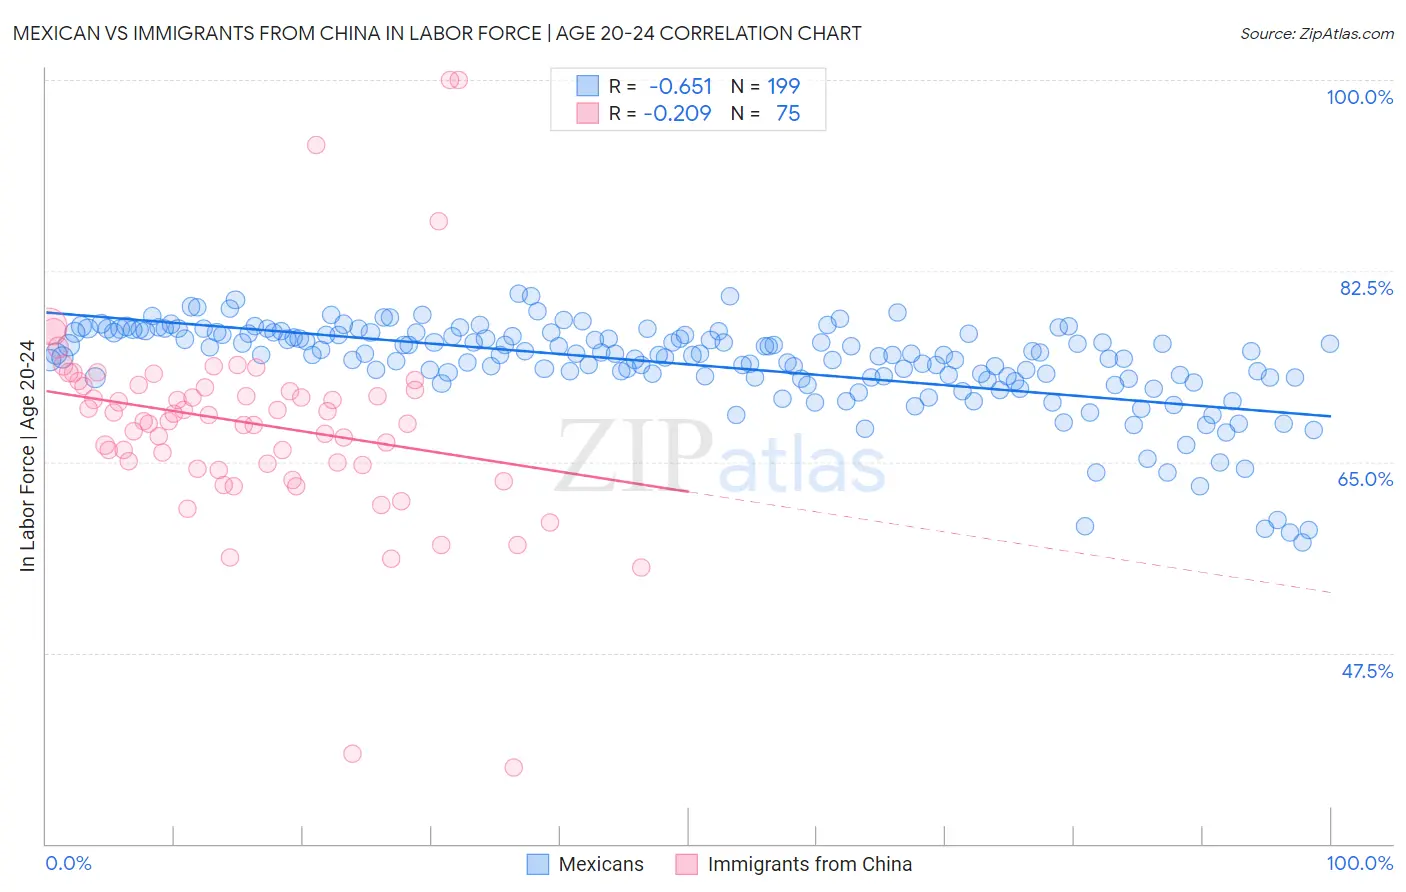
Mexican vs Immigrants from China In Labor Force | Age 20-24 Correlation Chart
The statistical analysis conducted on geographies consisting of 564,063,434 people shows a significant negative correlation between the proportion of Mexicans and labor force participation rate among population between the ages 20 and 24 in the United States with a correlation coefficient (R) of -0.651 and weighted average of 75.1%. Similarly, the statistical analysis conducted on geographies consisting of 456,875,563 people shows a weak negative correlation between the proportion of Immigrants from China and labor force participation rate among population between the ages 20 and 24 in the United States with a correlation coefficient (R) of -0.209 and weighted average of 71.1%, a difference of 5.7%.
In Labor Force | Age 20-24 Correlation Summary
| Measurement | Mexican | Immigrants from China |
| Minimum | 57.7% | 37.0% |
| Maximum | 80.4% | 100.0% |
| Range | 22.8% | 63.0% |
| Mean | 74.0% | 68.5% |
| Median | 74.9% | 68.8% |
| Interquartile 25% (IQ1) | 72.7% | 64.7% |
| Interquartile 75% (IQ3) | 76.8% | 71.9% |
| Interquartile Range (IQR) | 4.1% | 7.3% |
| Standard Deviation (Sample) | 4.2% | 9.5% |
| Standard Deviation (Population) | 4.2% | 9.4% |
Similar Demographics by In Labor Force | Age 20-24
Demographics Similar to Mexicans by In Labor Force | Age 20-24
In terms of in labor force | age 20-24, the demographic groups most similar to Mexicans are Cajun (75.1%, a difference of 0.010%), Yakama (75.1%, a difference of 0.020%), Immigrants from Croatia (75.1%, a difference of 0.030%), South African (75.0%, a difference of 0.030%), and Syrian (75.0%, a difference of 0.040%).
| Demographics | Rating | Rank | In Labor Force | Age 20-24 |
| Costa Ricans | 64.2 /100 | #163 | Good 75.2% |
| Bolivians | 64.0 /100 | #164 | Good 75.2% |
| Afghans | 63.5 /100 | #165 | Good 75.2% |
| Cambodians | 60.5 /100 | #166 | Good 75.2% |
| Immigrants | South Eastern Asia | 57.5 /100 | #167 | Average 75.1% |
| Immigrants | Western Africa | 56.7 /100 | #168 | Average 75.1% |
| Immigrants | Philippines | 55.8 /100 | #169 | Average 75.1% |
| Mexicans | 52.1 /100 | #170 | Average 75.1% |
| Cajuns | 51.1 /100 | #171 | Average 75.1% |
| Yakama | 50.8 /100 | #172 | Average 75.1% |
| Immigrants | Croatia | 50.2 /100 | #173 | Average 75.1% |
| South Africans | 50.0 /100 | #174 | Average 75.0% |
| Syrians | 49.5 /100 | #175 | Average 75.0% |
| Central Americans | 48.7 /100 | #176 | Average 75.0% |
| Immigrants | Mexico | 47.8 /100 | #177 | Average 75.0% |
Demographics Similar to Immigrants from China by In Labor Force | Age 20-24
In terms of in labor force | age 20-24, the demographic groups most similar to Immigrants from China are Dominican (71.1%, a difference of 0.020%), Immigrants from Trinidad and Tobago (71.1%, a difference of 0.020%), Barbadian (71.1%, a difference of 0.10%), Immigrants from Dominican Republic (71.2%, a difference of 0.21%), and Yup'ik (70.9%, a difference of 0.24%).
| Demographics | Rating | Rank | In Labor Force | Age 20-24 |
| Immigrants | Taiwan | 0.0 /100 | #321 | Tragic 71.5% |
| Filipinos | 0.0 /100 | #322 | Tragic 71.4% |
| West Indians | 0.0 /100 | #323 | Tragic 71.3% |
| Immigrants | Dominican Republic | 0.0 /100 | #324 | Tragic 71.2% |
| Barbadians | 0.0 /100 | #325 | Tragic 71.1% |
| Dominicans | 0.0 /100 | #326 | Tragic 71.1% |
| Immigrants | Trinidad and Tobago | 0.0 /100 | #327 | Tragic 71.1% |
| Immigrants | China | 0.0 /100 | #328 | Tragic 71.1% |
| Yup'ik | 0.0 /100 | #329 | Tragic 70.9% |
| Vietnamese | 0.0 /100 | #330 | Tragic 70.6% |
| Immigrants | Bangladesh | 0.0 /100 | #331 | Tragic 70.6% |
| Immigrants | Uzbekistan | 0.0 /100 | #332 | Tragic 70.4% |
| Yuman | 0.0 /100 | #333 | Tragic 70.3% |
| British West Indians | 0.0 /100 | #334 | Tragic 70.0% |
| Immigrants | Barbados | 0.0 /100 | #335 | Tragic 69.7% |