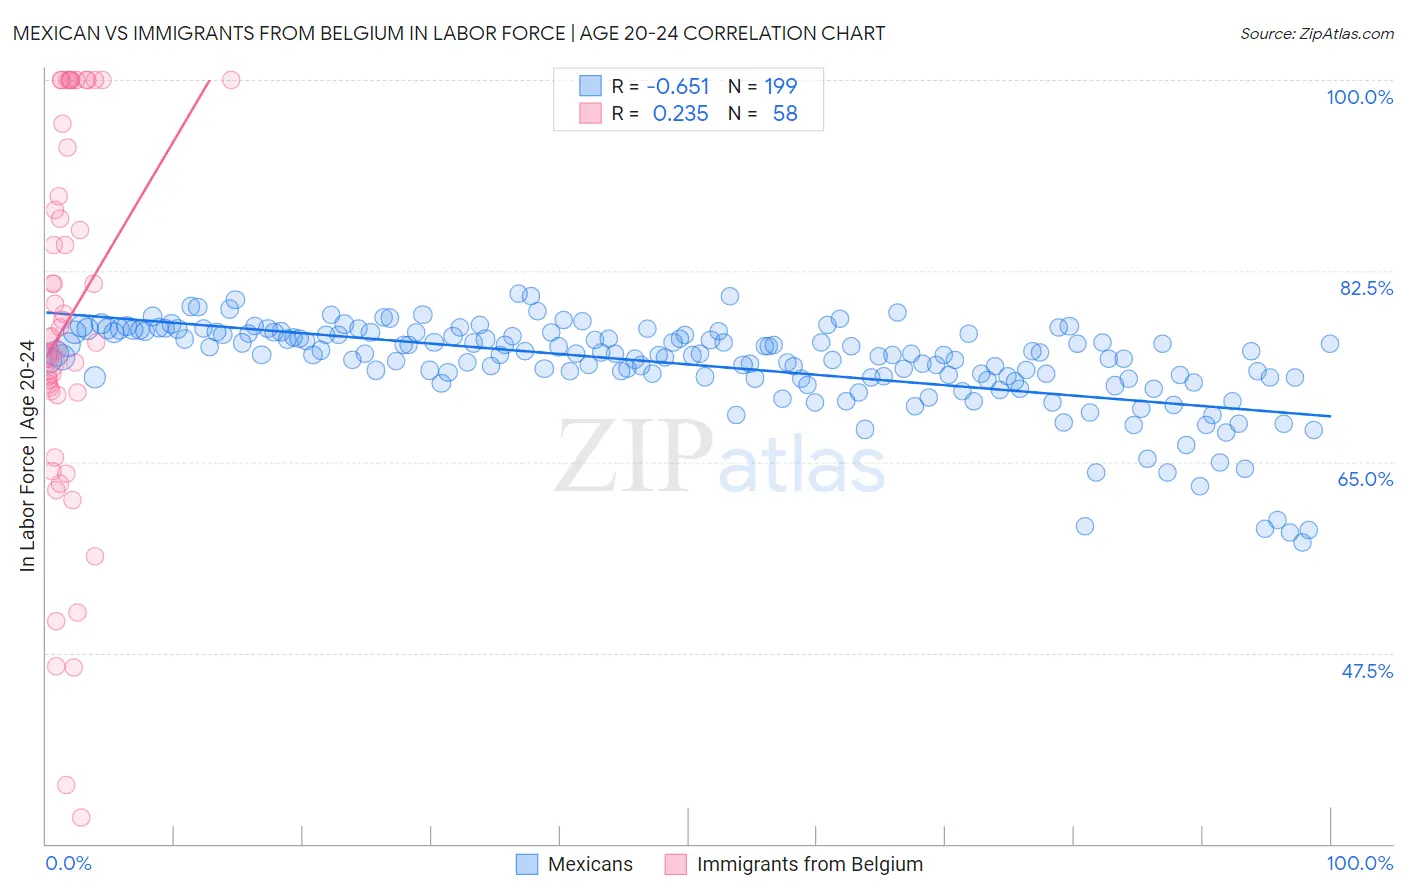
Mexican vs Immigrants from Belgium In Labor Force | Age 20-24
COMPARE
Mexican
Immigrants from Belgium
In Labor Force | Age 20-24
In Labor Force | Age 20-24 Comparison
Mexicans
Immigrants from Belgium
75.1%
IN LABOR FORCE | AGE 20-24
52.1/ 100
METRIC RATING
170th/ 347
METRIC RANK
73.9%
IN LABOR FORCE | AGE 20-24
1.3/ 100
METRIC RATING
250th/ 347
METRIC RANK
Mexican vs Immigrants from Belgium In Labor Force | Age 20-24 Correlation Chart
The statistical analysis conducted on geographies consisting of 564,063,434 people shows a significant negative correlation between the proportion of Mexicans and labor force participation rate among population between the ages 20 and 24 in the United States with a correlation coefficient (R) of -0.651 and weighted average of 75.1%. Similarly, the statistical analysis conducted on geographies consisting of 146,712,766 people shows a weak positive correlation between the proportion of Immigrants from Belgium and labor force participation rate among population between the ages 20 and 24 in the United States with a correlation coefficient (R) of 0.235 and weighted average of 73.9%, a difference of 1.7%.
In Labor Force | Age 20-24 Correlation Summary
| Measurement | Mexican | Immigrants from Belgium |
| Minimum | 57.7% | 32.4% |
| Maximum | 80.4% | 100.0% |
| Range | 22.8% | 67.6% |
| Mean | 74.0% | 77.9% |
| Median | 74.9% | 76.4% |
| Interquartile 25% (IQ1) | 72.7% | 71.4% |
| Interquartile 75% (IQ3) | 76.8% | 93.8% |
| Interquartile Range (IQR) | 4.1% | 22.4% |
| Standard Deviation (Sample) | 4.2% | 17.2% |
| Standard Deviation (Population) | 4.2% | 17.1% |
Similar Demographics by In Labor Force | Age 20-24
Demographics Similar to Mexicans by In Labor Force | Age 20-24
In terms of in labor force | age 20-24, the demographic groups most similar to Mexicans are Cajun (75.1%, a difference of 0.010%), Yakama (75.1%, a difference of 0.020%), Immigrants from Croatia (75.1%, a difference of 0.030%), South African (75.0%, a difference of 0.030%), and Syrian (75.0%, a difference of 0.040%).
| Demographics | Rating | Rank | In Labor Force | Age 20-24 |
| Costa Ricans | 64.2 /100 | #163 | Good 75.2% |
| Bolivians | 64.0 /100 | #164 | Good 75.2% |
| Afghans | 63.5 /100 | #165 | Good 75.2% |
| Cambodians | 60.5 /100 | #166 | Good 75.2% |
| Immigrants | South Eastern Asia | 57.5 /100 | #167 | Average 75.1% |
| Immigrants | Western Africa | 56.7 /100 | #168 | Average 75.1% |
| Immigrants | Philippines | 55.8 /100 | #169 | Average 75.1% |
| Mexicans | 52.1 /100 | #170 | Average 75.1% |
| Cajuns | 51.1 /100 | #171 | Average 75.1% |
| Yakama | 50.8 /100 | #172 | Average 75.1% |
| Immigrants | Croatia | 50.2 /100 | #173 | Average 75.1% |
| South Africans | 50.0 /100 | #174 | Average 75.0% |
| Syrians | 49.5 /100 | #175 | Average 75.0% |
| Central Americans | 48.7 /100 | #176 | Average 75.0% |
| Immigrants | Mexico | 47.8 /100 | #177 | Average 75.0% |
Demographics Similar to Immigrants from Belgium by In Labor Force | Age 20-24
In terms of in labor force | age 20-24, the demographic groups most similar to Immigrants from Belgium are Black/African American (73.9%, a difference of 0.0%), Immigrants from Egypt (73.8%, a difference of 0.020%), Immigrants from Kazakhstan (73.8%, a difference of 0.040%), Immigrants from Saudi Arabia (73.9%, a difference of 0.050%), and Colville (73.9%, a difference of 0.060%).
| Demographics | Rating | Rank | In Labor Force | Age 20-24 |
| Immigrants | Syria | 1.9 /100 | #243 | Tragic 74.0% |
| Immigrants | South Central Asia | 1.9 /100 | #244 | Tragic 74.0% |
| Turks | 1.8 /100 | #245 | Tragic 73.9% |
| Immigrants | Panama | 1.6 /100 | #246 | Tragic 73.9% |
| Colville | 1.5 /100 | #247 | Tragic 73.9% |
| Immigrants | Saudi Arabia | 1.5 /100 | #248 | Tragic 73.9% |
| Blacks/African Americans | 1.3 /100 | #249 | Tragic 73.9% |
| Immigrants | Belgium | 1.3 /100 | #250 | Tragic 73.9% |
| Immigrants | Egypt | 1.2 /100 | #251 | Tragic 73.8% |
| Immigrants | Kazakhstan | 1.1 /100 | #252 | Tragic 73.8% |
| Arapaho | 1.0 /100 | #253 | Tragic 73.8% |
| Ute | 1.0 /100 | #254 | Tragic 73.8% |
| Immigrants | Pakistan | 0.9 /100 | #255 | Tragic 73.8% |
| Spanish American Indians | 0.8 /100 | #256 | Tragic 73.7% |
| Paraguayans | 0.8 /100 | #257 | Tragic 73.7% |