Immigrants from Uganda vs Immigrants from Caribbean In Labor Force | Age 20-24
COMPARE
Immigrants from Uganda
Immigrants from Caribbean
In Labor Force | Age 20-24
In Labor Force | Age 20-24 Comparison
Immigrants from Uganda
Immigrants from Caribbean
76.0%
IN LABOR FORCE | AGE 20-24
97.1/ 100
METRIC RATING
106th/ 347
METRIC RANK
71.9%
IN LABOR FORCE | AGE 20-24
0.0/ 100
METRIC RATING
312th/ 347
METRIC RANK
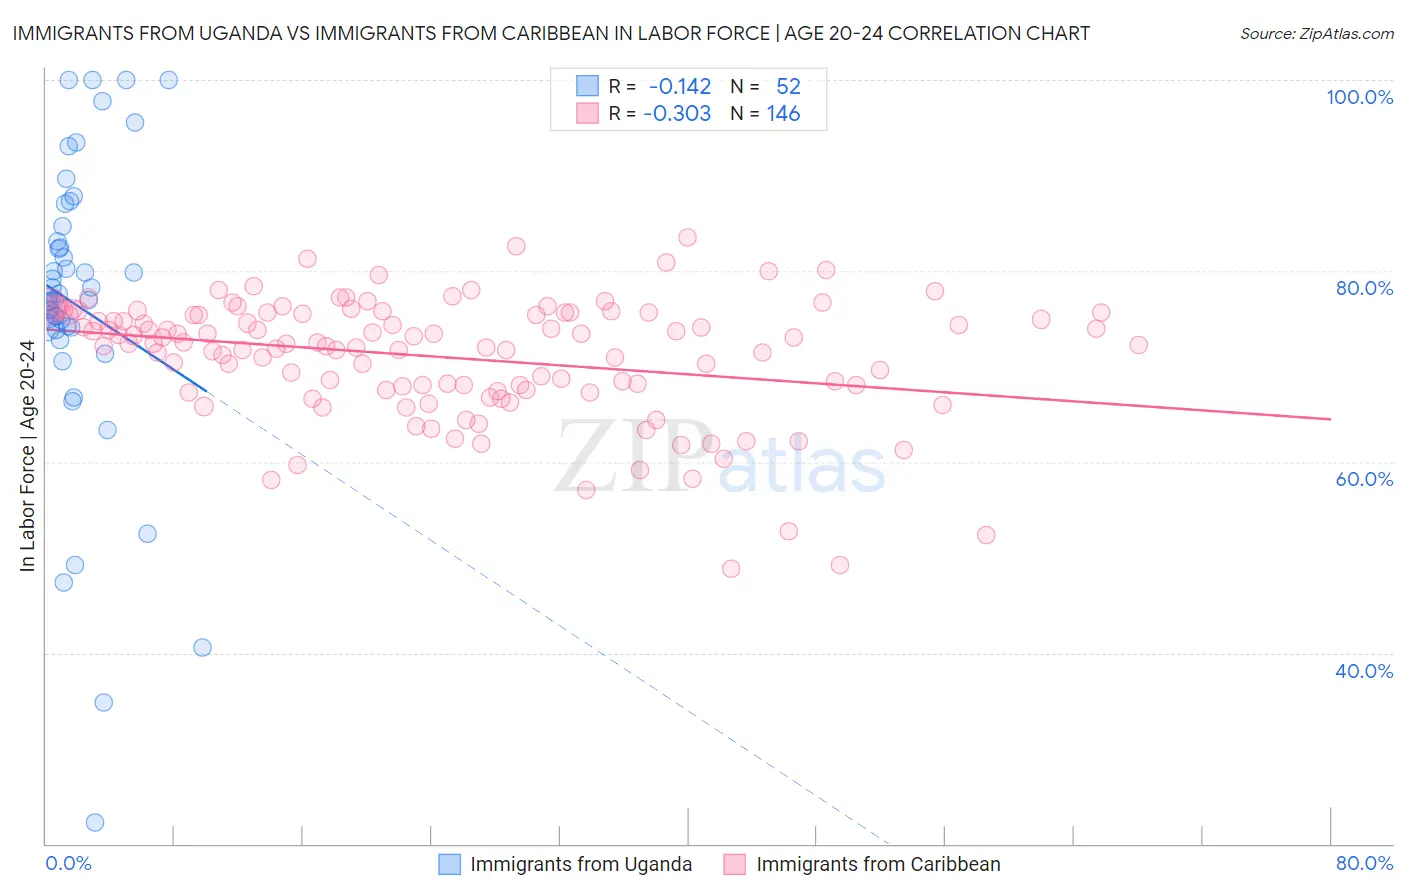
Immigrants from Uganda vs Immigrants from Caribbean In Labor Force | Age 20-24 Correlation Chart
The statistical analysis conducted on geographies consisting of 125,978,128 people shows a poor negative correlation between the proportion of Immigrants from Uganda and labor force participation rate among population between the ages 20 and 24 in the United States with a correlation coefficient (R) of -0.142 and weighted average of 76.0%. Similarly, the statistical analysis conducted on geographies consisting of 449,795,737 people shows a mild negative correlation between the proportion of Immigrants from Caribbean and labor force participation rate among population between the ages 20 and 24 in the United States with a correlation coefficient (R) of -0.303 and weighted average of 71.9%, a difference of 5.7%.
In Labor Force | Age 20-24 Correlation Summary
| Measurement | Immigrants from Uganda | Immigrants from Caribbean |
| Minimum | 22.2% | 48.8% |
| Maximum | 100.0% | 83.5% |
| Range | 77.8% | 34.7% |
| Mean | 76.3% | 71.0% |
| Median | 77.1% | 72.4% |
| Interquartile 25% (IQ1) | 73.9% | 67.6% |
| Interquartile 75% (IQ3) | 83.9% | 75.6% |
| Interquartile Range (IQR) | 10.0% | 8.0% |
| Standard Deviation (Sample) | 16.0% | 6.3% |
| Standard Deviation (Population) | 15.8% | 6.3% |
Similar Demographics by In Labor Force | Age 20-24
Demographics Similar to Immigrants from Uganda by In Labor Force | Age 20-24
In terms of in labor force | age 20-24, the demographic groups most similar to Immigrants from Uganda are Immigrants from Nepal (76.0%, a difference of 0.010%), Macedonian (76.0%, a difference of 0.020%), Greek (76.0%, a difference of 0.030%), Immigrants from North Macedonia (76.1%, a difference of 0.060%), and Iraqi (76.0%, a difference of 0.060%).
| Demographics | Rating | Rank | In Labor Force | Age 20-24 |
| Americans | 97.8 /100 | #99 | Exceptional 76.1% |
| Shoshone | 97.8 /100 | #100 | Exceptional 76.1% |
| Immigrants | Poland | 97.7 /100 | #101 | Exceptional 76.1% |
| Latvians | 97.6 /100 | #102 | Exceptional 76.1% |
| Immigrants | North Macedonia | 97.5 /100 | #103 | Exceptional 76.1% |
| Macedonians | 97.2 /100 | #104 | Exceptional 76.0% |
| Immigrants | Nepal | 97.2 /100 | #105 | Exceptional 76.0% |
| Immigrants | Uganda | 97.1 /100 | #106 | Exceptional 76.0% |
| Greeks | 96.9 /100 | #107 | Exceptional 76.0% |
| Iraqis | 96.6 /100 | #108 | Exceptional 76.0% |
| Cherokee | 95.8 /100 | #109 | Exceptional 75.9% |
| Immigrants | Morocco | 95.8 /100 | #110 | Exceptional 75.9% |
| Ukrainians | 95.7 /100 | #111 | Exceptional 75.9% |
| Immigrants | Canada | 95.6 /100 | #112 | Exceptional 75.9% |
| Immigrants | Netherlands | 95.3 /100 | #113 | Exceptional 75.9% |
Demographics Similar to Immigrants from Caribbean by In Labor Force | Age 20-24
In terms of in labor force | age 20-24, the demographic groups most similar to Immigrants from Caribbean are Immigrants from Dominica (71.9%, a difference of 0.050%), Indian (Asian) (71.9%, a difference of 0.060%), Apache (72.0%, a difference of 0.070%), Immigrants from Cuba (72.0%, a difference of 0.080%), and Immigrants from Iran (71.8%, a difference of 0.14%).
| Demographics | Rating | Rank | In Labor Force | Age 20-24 |
| Immigrants | Singapore | 0.0 /100 | #305 | Tragic 72.4% |
| Immigrants | Jamaica | 0.0 /100 | #306 | Tragic 72.4% |
| Immigrants | Ecuador | 0.0 /100 | #307 | Tragic 72.3% |
| Soviet Union | 0.0 /100 | #308 | Tragic 72.3% |
| Tsimshian | 0.0 /100 | #309 | Tragic 72.3% |
| Immigrants | Cuba | 0.0 /100 | #310 | Tragic 72.0% |
| Apache | 0.0 /100 | #311 | Tragic 72.0% |
| Immigrants | Caribbean | 0.0 /100 | #312 | Tragic 71.9% |
| Immigrants | Dominica | 0.0 /100 | #313 | Tragic 71.9% |
| Indians (Asian) | 0.0 /100 | #314 | Tragic 71.9% |
| Immigrants | Iran | 0.0 /100 | #315 | Tragic 71.8% |
| Immigrants | Eastern Asia | 0.0 /100 | #316 | Tragic 71.8% |
| Immigrants | Armenia | 0.0 /100 | #317 | Tragic 71.7% |
| Immigrants | Hong Kong | 0.0 /100 | #318 | Tragic 71.6% |
| Immigrants | Israel | 0.0 /100 | #319 | Tragic 71.6% |