Immigrants from Afghanistan vs Immigrants from Caribbean In Labor Force | Age 20-24
COMPARE
Immigrants from Afghanistan
Immigrants from Caribbean
In Labor Force | Age 20-24
In Labor Force | Age 20-24 Comparison
Immigrants from Afghanistan
Immigrants from Caribbean
75.6%
IN LABOR FORCE | AGE 20-24
89.4/ 100
METRIC RATING
128th/ 347
METRIC RANK
71.9%
IN LABOR FORCE | AGE 20-24
0.0/ 100
METRIC RATING
312th/ 347
METRIC RANK
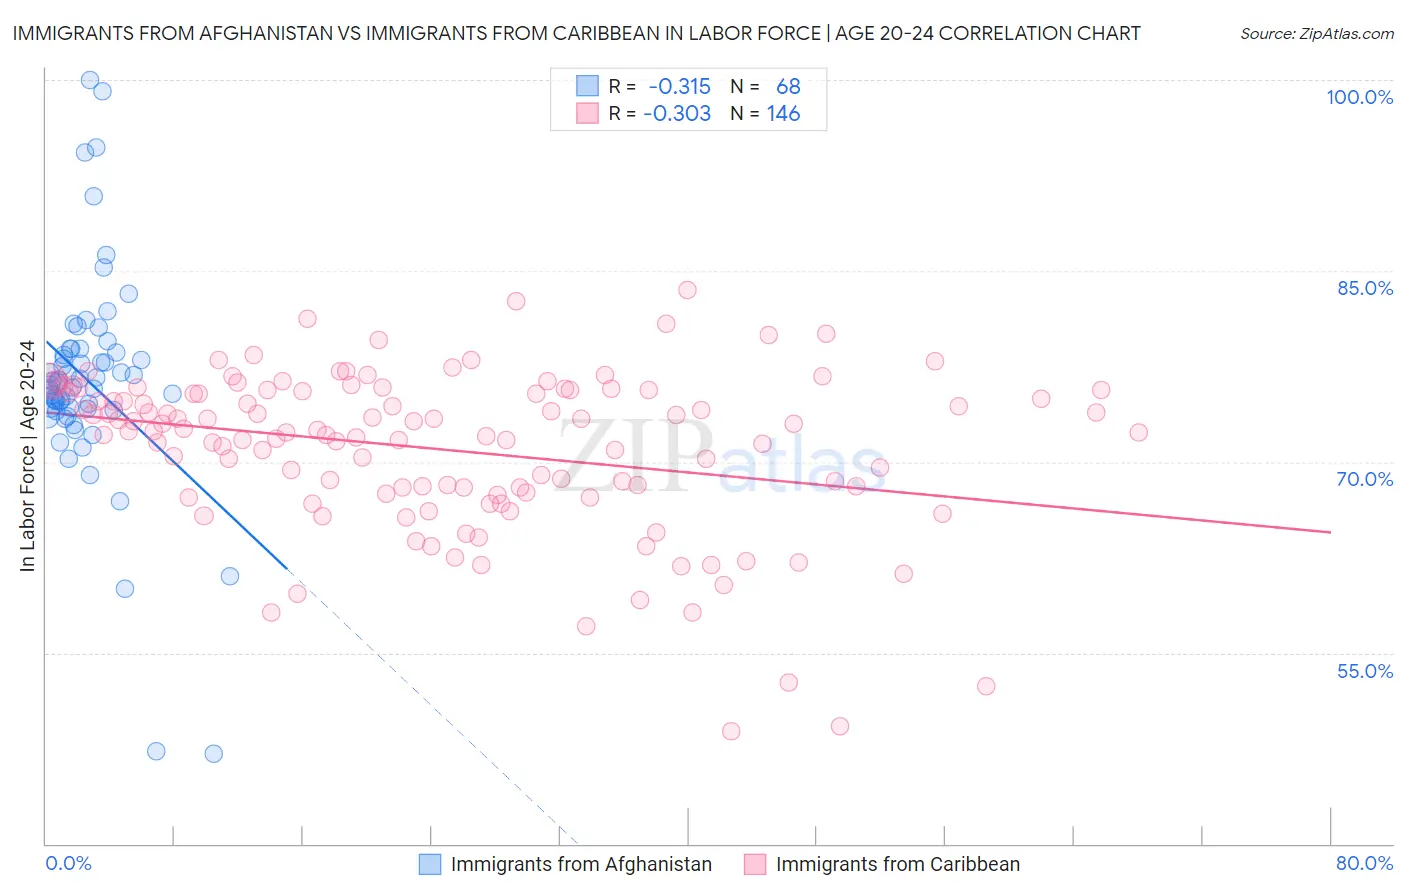
Immigrants from Afghanistan vs Immigrants from Caribbean In Labor Force | Age 20-24 Correlation Chart
The statistical analysis conducted on geographies consisting of 147,610,096 people shows a mild negative correlation between the proportion of Immigrants from Afghanistan and labor force participation rate among population between the ages 20 and 24 in the United States with a correlation coefficient (R) of -0.315 and weighted average of 75.6%. Similarly, the statistical analysis conducted on geographies consisting of 449,795,737 people shows a mild negative correlation between the proportion of Immigrants from Caribbean and labor force participation rate among population between the ages 20 and 24 in the United States with a correlation coefficient (R) of -0.303 and weighted average of 71.9%, a difference of 5.2%.
In Labor Force | Age 20-24 Correlation Summary
| Measurement | Immigrants from Afghanistan | Immigrants from Caribbean |
| Minimum | 47.1% | 48.8% |
| Maximum | 100.0% | 83.5% |
| Range | 52.9% | 34.7% |
| Mean | 76.4% | 71.0% |
| Median | 76.2% | 72.4% |
| Interquartile 25% (IQ1) | 74.2% | 67.6% |
| Interquartile 75% (IQ3) | 78.7% | 75.6% |
| Interquartile Range (IQR) | 4.6% | 8.0% |
| Standard Deviation (Sample) | 8.5% | 6.3% |
| Standard Deviation (Population) | 8.5% | 6.3% |
Similar Demographics by In Labor Force | Age 20-24
Demographics Similar to Immigrants from Afghanistan by In Labor Force | Age 20-24
In terms of in labor force | age 20-24, the demographic groups most similar to Immigrants from Afghanistan are Iroquois (75.6%, a difference of 0.010%), Immigrants from Austria (75.6%, a difference of 0.020%), Immigrants from Jordan (75.6%, a difference of 0.030%), Palestinian (75.6%, a difference of 0.040%), and Zimbabwean (75.6%, a difference of 0.040%).
| Demographics | Rating | Rank | In Labor Force | Age 20-24 |
| Immigrants | Serbia | 94.3 /100 | #121 | Exceptional 75.8% |
| Pakistanis | 94.1 /100 | #122 | Exceptional 75.8% |
| Immigrants | Bulgaria | 94.1 /100 | #123 | Exceptional 75.8% |
| Immigrants | Sierra Leone | 93.8 /100 | #124 | Exceptional 75.8% |
| Immigrants | Scotland | 93.7 /100 | #125 | Exceptional 75.8% |
| Brazilians | 93.0 /100 | #126 | Exceptional 75.8% |
| Sub-Saharan Africans | 90.9 /100 | #127 | Exceptional 75.7% |
| Immigrants | Afghanistan | 89.4 /100 | #128 | Excellent 75.6% |
| Iroquois | 89.1 /100 | #129 | Excellent 75.6% |
| Immigrants | Austria | 88.8 /100 | #130 | Excellent 75.6% |
| Immigrants | Jordan | 88.5 /100 | #131 | Excellent 75.6% |
| Palestinians | 88.4 /100 | #132 | Excellent 75.6% |
| Zimbabweans | 88.2 /100 | #133 | Excellent 75.6% |
| Estonians | 87.1 /100 | #134 | Excellent 75.6% |
| Yaqui | 85.5 /100 | #135 | Excellent 75.5% |
Demographics Similar to Immigrants from Caribbean by In Labor Force | Age 20-24
In terms of in labor force | age 20-24, the demographic groups most similar to Immigrants from Caribbean are Immigrants from Dominica (71.9%, a difference of 0.050%), Indian (Asian) (71.9%, a difference of 0.060%), Apache (72.0%, a difference of 0.070%), Immigrants from Cuba (72.0%, a difference of 0.080%), and Immigrants from Iran (71.8%, a difference of 0.14%).
| Demographics | Rating | Rank | In Labor Force | Age 20-24 |
| Immigrants | Singapore | 0.0 /100 | #305 | Tragic 72.4% |
| Immigrants | Jamaica | 0.0 /100 | #306 | Tragic 72.4% |
| Immigrants | Ecuador | 0.0 /100 | #307 | Tragic 72.3% |
| Soviet Union | 0.0 /100 | #308 | Tragic 72.3% |
| Tsimshian | 0.0 /100 | #309 | Tragic 72.3% |
| Immigrants | Cuba | 0.0 /100 | #310 | Tragic 72.0% |
| Apache | 0.0 /100 | #311 | Tragic 72.0% |
| Immigrants | Caribbean | 0.0 /100 | #312 | Tragic 71.9% |
| Immigrants | Dominica | 0.0 /100 | #313 | Tragic 71.9% |
| Indians (Asian) | 0.0 /100 | #314 | Tragic 71.9% |
| Immigrants | Iran | 0.0 /100 | #315 | Tragic 71.8% |
| Immigrants | Eastern Asia | 0.0 /100 | #316 | Tragic 71.8% |
| Immigrants | Armenia | 0.0 /100 | #317 | Tragic 71.7% |
| Immigrants | Hong Kong | 0.0 /100 | #318 | Tragic 71.6% |
| Immigrants | Israel | 0.0 /100 | #319 | Tragic 71.6% |