Mexican vs Immigrants from Cambodia In Labor Force | Age 20-24
COMPARE
Mexican
Immigrants from Cambodia
In Labor Force | Age 20-24
In Labor Force | Age 20-24 Comparison
Mexicans
Immigrants from Cambodia
75.1%
IN LABOR FORCE | AGE 20-24
52.1/ 100
METRIC RATING
170th/ 347
METRIC RANK
75.4%
IN LABOR FORCE | AGE 20-24
76.7/ 100
METRIC RATING
148th/ 347
METRIC RANK
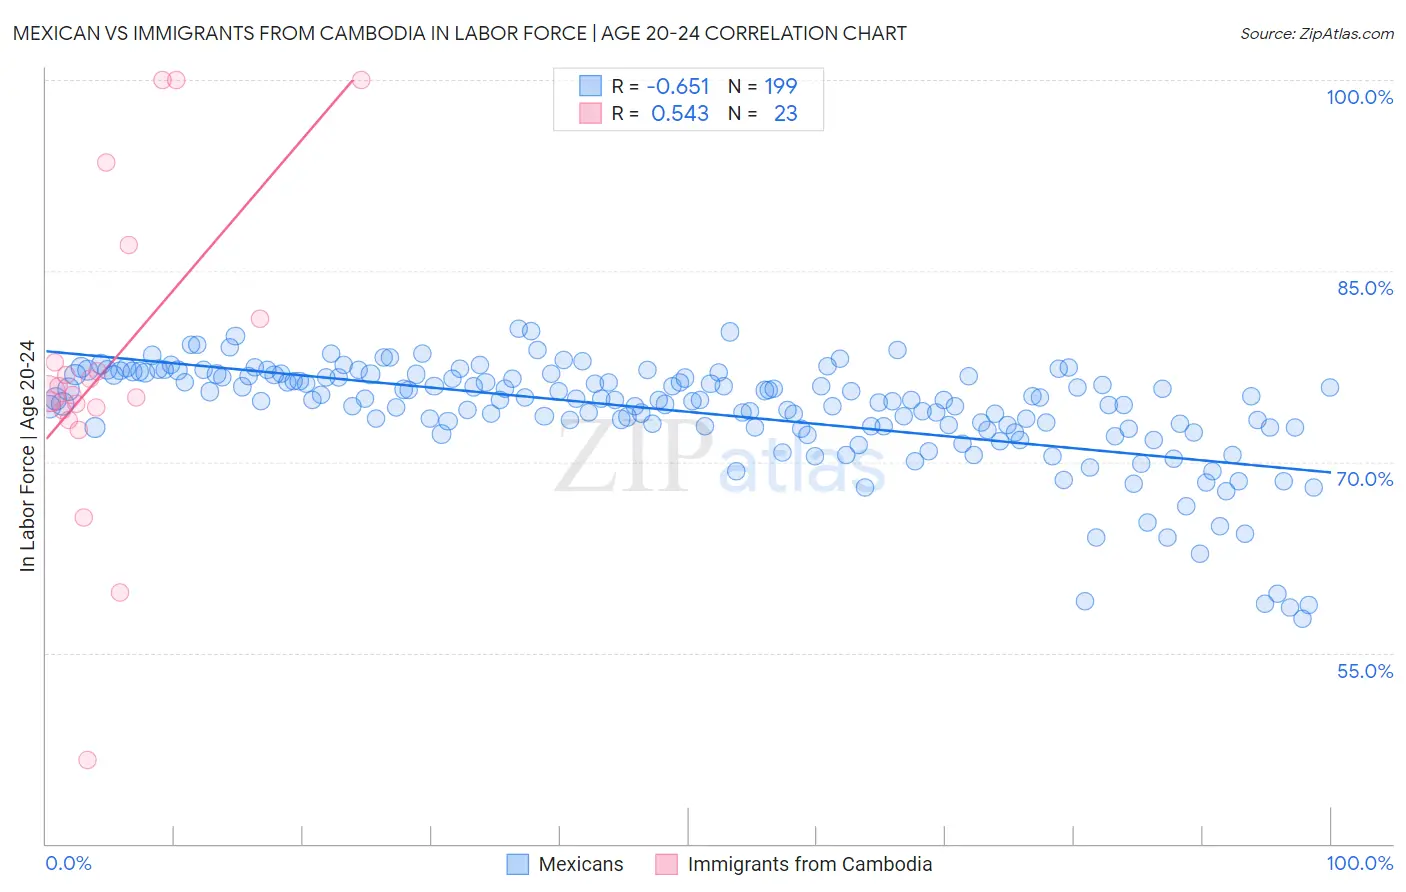
Mexican vs Immigrants from Cambodia In Labor Force | Age 20-24 Correlation Chart
The statistical analysis conducted on geographies consisting of 564,063,434 people shows a significant negative correlation between the proportion of Mexicans and labor force participation rate among population between the ages 20 and 24 in the United States with a correlation coefficient (R) of -0.651 and weighted average of 75.1%. Similarly, the statistical analysis conducted on geographies consisting of 205,146,511 people shows a substantial positive correlation between the proportion of Immigrants from Cambodia and labor force participation rate among population between the ages 20 and 24 in the United States with a correlation coefficient (R) of 0.543 and weighted average of 75.4%, a difference of 0.41%.
In Labor Force | Age 20-24 Correlation Summary
| Measurement | Mexican | Immigrants from Cambodia |
| Minimum | 57.7% | 46.5% |
| Maximum | 80.4% | 100.0% |
| Range | 22.8% | 53.5% |
| Mean | 74.0% | 77.7% |
| Median | 74.9% | 75.4% |
| Interquartile 25% (IQ1) | 72.7% | 74.1% |
| Interquartile 75% (IQ3) | 76.8% | 81.2% |
| Interquartile Range (IQR) | 4.1% | 7.1% |
| Standard Deviation (Sample) | 4.2% | 12.4% |
| Standard Deviation (Population) | 4.2% | 12.1% |
Similar Demographics by In Labor Force | Age 20-24
Demographics Similar to Mexicans by In Labor Force | Age 20-24
In terms of in labor force | age 20-24, the demographic groups most similar to Mexicans are Cajun (75.1%, a difference of 0.010%), Yakama (75.1%, a difference of 0.020%), Immigrants from Croatia (75.1%, a difference of 0.030%), South African (75.0%, a difference of 0.030%), and Syrian (75.0%, a difference of 0.040%).
| Demographics | Rating | Rank | In Labor Force | Age 20-24 |
| Costa Ricans | 64.2 /100 | #163 | Good 75.2% |
| Bolivians | 64.0 /100 | #164 | Good 75.2% |
| Afghans | 63.5 /100 | #165 | Good 75.2% |
| Cambodians | 60.5 /100 | #166 | Good 75.2% |
| Immigrants | South Eastern Asia | 57.5 /100 | #167 | Average 75.1% |
| Immigrants | Western Africa | 56.7 /100 | #168 | Average 75.1% |
| Immigrants | Philippines | 55.8 /100 | #169 | Average 75.1% |
| Mexicans | 52.1 /100 | #170 | Average 75.1% |
| Cajuns | 51.1 /100 | #171 | Average 75.1% |
| Yakama | 50.8 /100 | #172 | Average 75.1% |
| Immigrants | Croatia | 50.2 /100 | #173 | Average 75.1% |
| South Africans | 50.0 /100 | #174 | Average 75.0% |
| Syrians | 49.5 /100 | #175 | Average 75.0% |
| Central Americans | 48.7 /100 | #176 | Average 75.0% |
| Immigrants | Mexico | 47.8 /100 | #177 | Average 75.0% |
Demographics Similar to Immigrants from Cambodia by In Labor Force | Age 20-24
In terms of in labor force | age 20-24, the demographic groups most similar to Immigrants from Cambodia are Ugandan (75.4%, a difference of 0.010%), Comanche (75.4%, a difference of 0.020%), Mexican American Indian (75.4%, a difference of 0.040%), Salvadoran (75.3%, a difference of 0.040%), and Paiute (75.3%, a difference of 0.050%).
| Demographics | Rating | Rank | In Labor Force | Age 20-24 |
| Romanians | 84.1 /100 | #141 | Excellent 75.5% |
| Blackfeet | 83.6 /100 | #142 | Excellent 75.5% |
| Spaniards | 82.0 /100 | #143 | Excellent 75.5% |
| Bhutanese | 80.8 /100 | #144 | Excellent 75.4% |
| Koreans | 79.7 /100 | #145 | Good 75.4% |
| Mexican American Indians | 78.8 /100 | #146 | Good 75.4% |
| Comanche | 77.6 /100 | #147 | Good 75.4% |
| Immigrants | Cambodia | 76.7 /100 | #148 | Good 75.4% |
| Ugandans | 76.1 /100 | #149 | Good 75.4% |
| Salvadorans | 74.8 /100 | #150 | Good 75.3% |
| Paiute | 74.1 /100 | #151 | Good 75.3% |
| Lebanese | 73.5 /100 | #152 | Good 75.3% |
| Guatemalans | 72.3 /100 | #153 | Good 75.3% |
| Osage | 72.3 /100 | #154 | Good 75.3% |
| Immigrants | Guatemala | 71.9 /100 | #155 | Good 75.3% |