Mexican vs Irish In Labor Force | Age 20-24
COMPARE
Mexican
Irish
In Labor Force | Age 20-24
In Labor Force | Age 20-24 Comparison
Mexicans
Irish
75.1%
IN LABOR FORCE | AGE 20-24
52.1/ 100
METRIC RATING
170th/ 347
METRIC RANK
77.4%
IN LABOR FORCE | AGE 20-24
100.0/ 100
METRIC RATING
39th/ 347
METRIC RANK
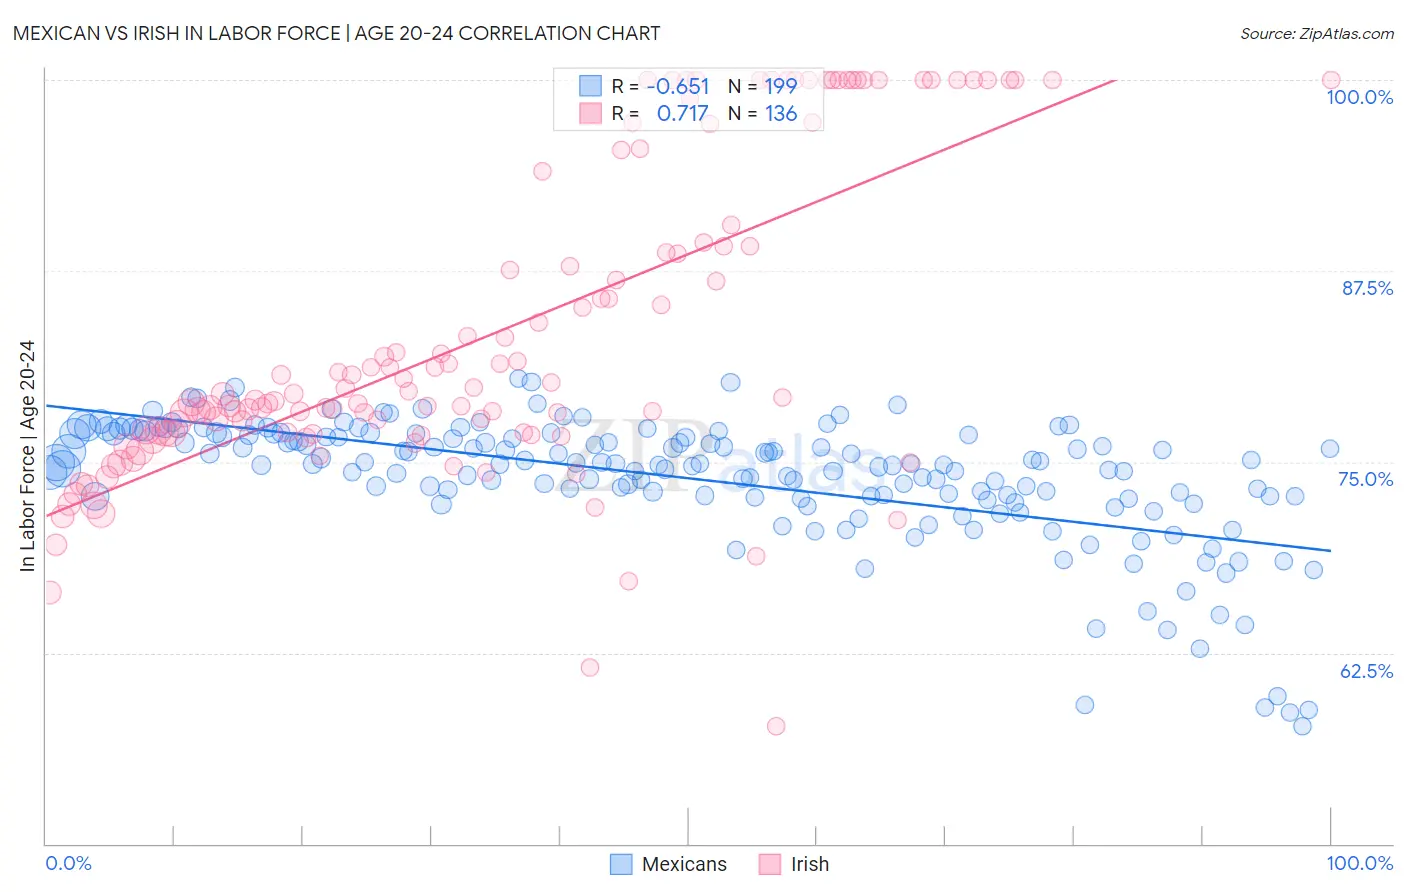
Mexican vs Irish In Labor Force | Age 20-24 Correlation Chart
The statistical analysis conducted on geographies consisting of 564,063,434 people shows a significant negative correlation between the proportion of Mexicans and labor force participation rate among population between the ages 20 and 24 in the United States with a correlation coefficient (R) of -0.651 and weighted average of 75.1%. Similarly, the statistical analysis conducted on geographies consisting of 578,188,051 people shows a strong positive correlation between the proportion of Irish and labor force participation rate among population between the ages 20 and 24 in the United States with a correlation coefficient (R) of 0.717 and weighted average of 77.4%, a difference of 3.1%.
In Labor Force | Age 20-24 Correlation Summary
| Measurement | Mexican | Irish |
| Minimum | 57.7% | 57.7% |
| Maximum | 80.4% | 100.0% |
| Range | 22.8% | 42.3% |
| Mean | 74.0% | 83.4% |
| Median | 74.9% | 79.5% |
| Interquartile 25% (IQ1) | 72.7% | 76.9% |
| Interquartile 75% (IQ3) | 76.8% | 89.9% |
| Interquartile Range (IQR) | 4.1% | 13.1% |
| Standard Deviation (Sample) | 4.2% | 10.2% |
| Standard Deviation (Population) | 4.2% | 10.2% |
Similar Demographics by In Labor Force | Age 20-24
Demographics Similar to Mexicans by In Labor Force | Age 20-24
In terms of in labor force | age 20-24, the demographic groups most similar to Mexicans are Cajun (75.1%, a difference of 0.010%), Yakama (75.1%, a difference of 0.020%), Immigrants from Croatia (75.1%, a difference of 0.030%), South African (75.0%, a difference of 0.030%), and Syrian (75.0%, a difference of 0.040%).
| Demographics | Rating | Rank | In Labor Force | Age 20-24 |
| Costa Ricans | 64.2 /100 | #163 | Good 75.2% |
| Bolivians | 64.0 /100 | #164 | Good 75.2% |
| Afghans | 63.5 /100 | #165 | Good 75.2% |
| Cambodians | 60.5 /100 | #166 | Good 75.2% |
| Immigrants | South Eastern Asia | 57.5 /100 | #167 | Average 75.1% |
| Immigrants | Western Africa | 56.7 /100 | #168 | Average 75.1% |
| Immigrants | Philippines | 55.8 /100 | #169 | Average 75.1% |
| Mexicans | 52.1 /100 | #170 | Average 75.1% |
| Cajuns | 51.1 /100 | #171 | Average 75.1% |
| Yakama | 50.8 /100 | #172 | Average 75.1% |
| Immigrants | Croatia | 50.2 /100 | #173 | Average 75.1% |
| South Africans | 50.0 /100 | #174 | Average 75.0% |
| Syrians | 49.5 /100 | #175 | Average 75.0% |
| Central Americans | 48.7 /100 | #176 | Average 75.0% |
| Immigrants | Mexico | 47.8 /100 | #177 | Average 75.0% |
Demographics Similar to Irish by In Labor Force | Age 20-24
In terms of in labor force | age 20-24, the demographic groups most similar to Irish are Marshallese (77.4%, a difference of 0.030%), Scottish (77.4%, a difference of 0.030%), Immigrants from Congo (77.4%, a difference of 0.040%), French (77.4%, a difference of 0.050%), and Immigrants from Laos (77.4%, a difference of 0.060%).
| Demographics | Rating | Rank | In Labor Force | Age 20-24 |
| English | 100.0 /100 | #32 | Exceptional 77.6% |
| Immigrants | Ethiopia | 100.0 /100 | #33 | Exceptional 77.5% |
| German Russians | 100.0 /100 | #34 | Exceptional 77.5% |
| Immigrants | Eastern Africa | 100.0 /100 | #35 | Exceptional 77.5% |
| Welsh | 100.0 /100 | #36 | Exceptional 77.5% |
| Czechoslovakians | 100.0 /100 | #37 | Exceptional 77.5% |
| Marshallese | 100.0 /100 | #38 | Exceptional 77.4% |
| Irish | 100.0 /100 | #39 | Exceptional 77.4% |
| Scottish | 100.0 /100 | #40 | Exceptional 77.4% |
| Immigrants | Congo | 100.0 /100 | #41 | Exceptional 77.4% |
| French | 100.0 /100 | #42 | Exceptional 77.4% |
| Immigrants | Laos | 100.0 /100 | #43 | Exceptional 77.4% |
| Fijians | 100.0 /100 | #44 | Exceptional 77.4% |
| Native Hawaiians | 100.0 /100 | #45 | Exceptional 77.4% |
| Samoans | 100.0 /100 | #46 | Exceptional 77.4% |