Immigrants from Netherlands vs Immigrants from Cambodia In Labor Force | Age 20-24
COMPARE
Immigrants from Netherlands
Immigrants from Cambodia
In Labor Force | Age 20-24
In Labor Force | Age 20-24 Comparison
Immigrants from Netherlands
Immigrants from Cambodia
75.9%
IN LABOR FORCE | AGE 20-24
95.3/ 100
METRIC RATING
113th/ 347
METRIC RANK
75.4%
IN LABOR FORCE | AGE 20-24
76.7/ 100
METRIC RATING
148th/ 347
METRIC RANK
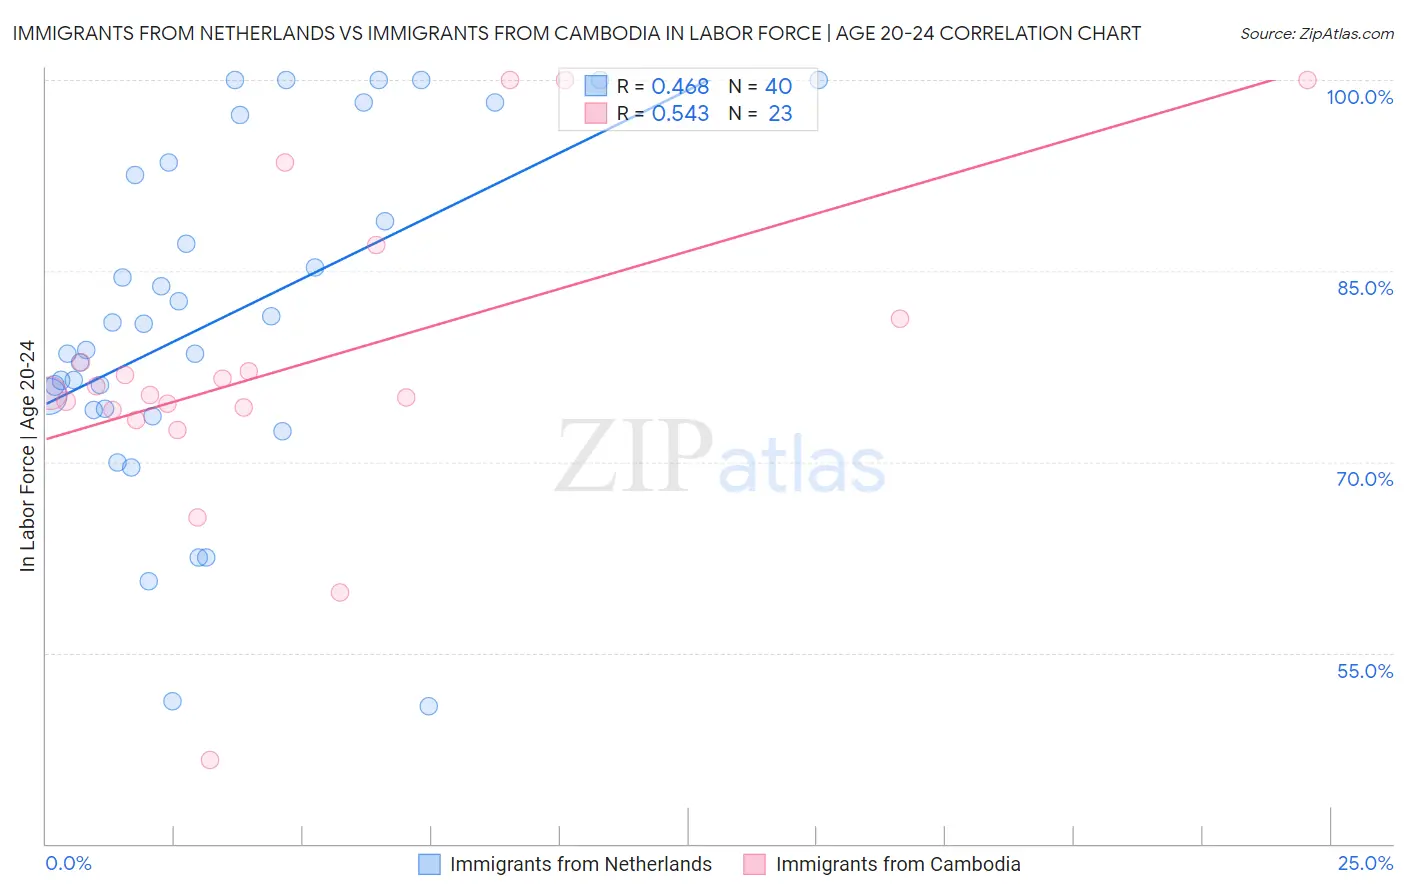
Immigrants from Netherlands vs Immigrants from Cambodia In Labor Force | Age 20-24 Correlation Chart
The statistical analysis conducted on geographies consisting of 237,756,787 people shows a moderate positive correlation between the proportion of Immigrants from Netherlands and labor force participation rate among population between the ages 20 and 24 in the United States with a correlation coefficient (R) of 0.468 and weighted average of 75.9%. Similarly, the statistical analysis conducted on geographies consisting of 205,146,511 people shows a substantial positive correlation between the proportion of Immigrants from Cambodia and labor force participation rate among population between the ages 20 and 24 in the United States with a correlation coefficient (R) of 0.543 and weighted average of 75.4%, a difference of 0.66%.
In Labor Force | Age 20-24 Correlation Summary
| Measurement | Immigrants from Netherlands | Immigrants from Cambodia |
| Minimum | 50.8% | 46.5% |
| Maximum | 100.0% | 100.0% |
| Range | 49.2% | 53.5% |
| Mean | 81.3% | 77.7% |
| Median | 79.8% | 75.4% |
| Interquartile 25% (IQ1) | 74.2% | 74.1% |
| Interquartile 75% (IQ3) | 93.0% | 81.2% |
| Interquartile Range (IQR) | 18.9% | 7.1% |
| Standard Deviation (Sample) | 13.4% | 12.4% |
| Standard Deviation (Population) | 13.2% | 12.1% |
Similar Demographics by In Labor Force | Age 20-24
Demographics Similar to Immigrants from Netherlands by In Labor Force | Age 20-24
In terms of in labor force | age 20-24, the demographic groups most similar to Immigrants from Netherlands are Immigrants from Zimbabwe (75.9%, a difference of 0.010%), Alaska Native (75.9%, a difference of 0.010%), Immigrants from North America (75.9%, a difference of 0.020%), Immigrants from Canada (75.9%, a difference of 0.030%), and Assyrian/Chaldean/Syriac (75.9%, a difference of 0.030%).
| Demographics | Rating | Rank | In Labor Force | Age 20-24 |
| Immigrants | Uganda | 97.1 /100 | #106 | Exceptional 76.0% |
| Greeks | 96.9 /100 | #107 | Exceptional 76.0% |
| Iraqis | 96.6 /100 | #108 | Exceptional 76.0% |
| Cherokee | 95.8 /100 | #109 | Exceptional 75.9% |
| Immigrants | Morocco | 95.8 /100 | #110 | Exceptional 75.9% |
| Ukrainians | 95.7 /100 | #111 | Exceptional 75.9% |
| Immigrants | Canada | 95.6 /100 | #112 | Exceptional 75.9% |
| Immigrants | Netherlands | 95.3 /100 | #113 | Exceptional 75.9% |
| Immigrants | Zimbabwe | 95.1 /100 | #114 | Exceptional 75.9% |
| Alaska Natives | 95.1 /100 | #115 | Exceptional 75.9% |
| Immigrants | North America | 95.0 /100 | #116 | Exceptional 75.9% |
| Assyrians/Chaldeans/Syriacs | 94.9 /100 | #117 | Exceptional 75.9% |
| Spanish Americans | 94.8 /100 | #118 | Exceptional 75.8% |
| Immigrants | Portugal | 94.8 /100 | #119 | Exceptional 75.8% |
| Immigrants | Africa | 94.6 /100 | #120 | Exceptional 75.8% |
Demographics Similar to Immigrants from Cambodia by In Labor Force | Age 20-24
In terms of in labor force | age 20-24, the demographic groups most similar to Immigrants from Cambodia are Ugandan (75.4%, a difference of 0.010%), Comanche (75.4%, a difference of 0.020%), Mexican American Indian (75.4%, a difference of 0.040%), Salvadoran (75.3%, a difference of 0.040%), and Paiute (75.3%, a difference of 0.050%).
| Demographics | Rating | Rank | In Labor Force | Age 20-24 |
| Romanians | 84.1 /100 | #141 | Excellent 75.5% |
| Blackfeet | 83.6 /100 | #142 | Excellent 75.5% |
| Spaniards | 82.0 /100 | #143 | Excellent 75.5% |
| Bhutanese | 80.8 /100 | #144 | Excellent 75.4% |
| Koreans | 79.7 /100 | #145 | Good 75.4% |
| Mexican American Indians | 78.8 /100 | #146 | Good 75.4% |
| Comanche | 77.6 /100 | #147 | Good 75.4% |
| Immigrants | Cambodia | 76.7 /100 | #148 | Good 75.4% |
| Ugandans | 76.1 /100 | #149 | Good 75.4% |
| Salvadorans | 74.8 /100 | #150 | Good 75.3% |
| Paiute | 74.1 /100 | #151 | Good 75.3% |
| Lebanese | 73.5 /100 | #152 | Good 75.3% |
| Guatemalans | 72.3 /100 | #153 | Good 75.3% |
| Osage | 72.3 /100 | #154 | Good 75.3% |
| Immigrants | Guatemala | 71.9 /100 | #155 | Good 75.3% |