Mexican vs Immigrants from Cambodia Average Family Size
COMPARE
Mexican
Immigrants from Cambodia
Average Family Size
Average Family Size Comparison
Mexicans
Immigrants from Cambodia
3.48
AVERAGE FAMILY SIZE
100.0/ 100
METRIC RATING
19th/ 347
METRIC RANK
3.33
AVERAGE FAMILY SIZE
99.9/ 100
METRIC RATING
68th/ 347
METRIC RANK
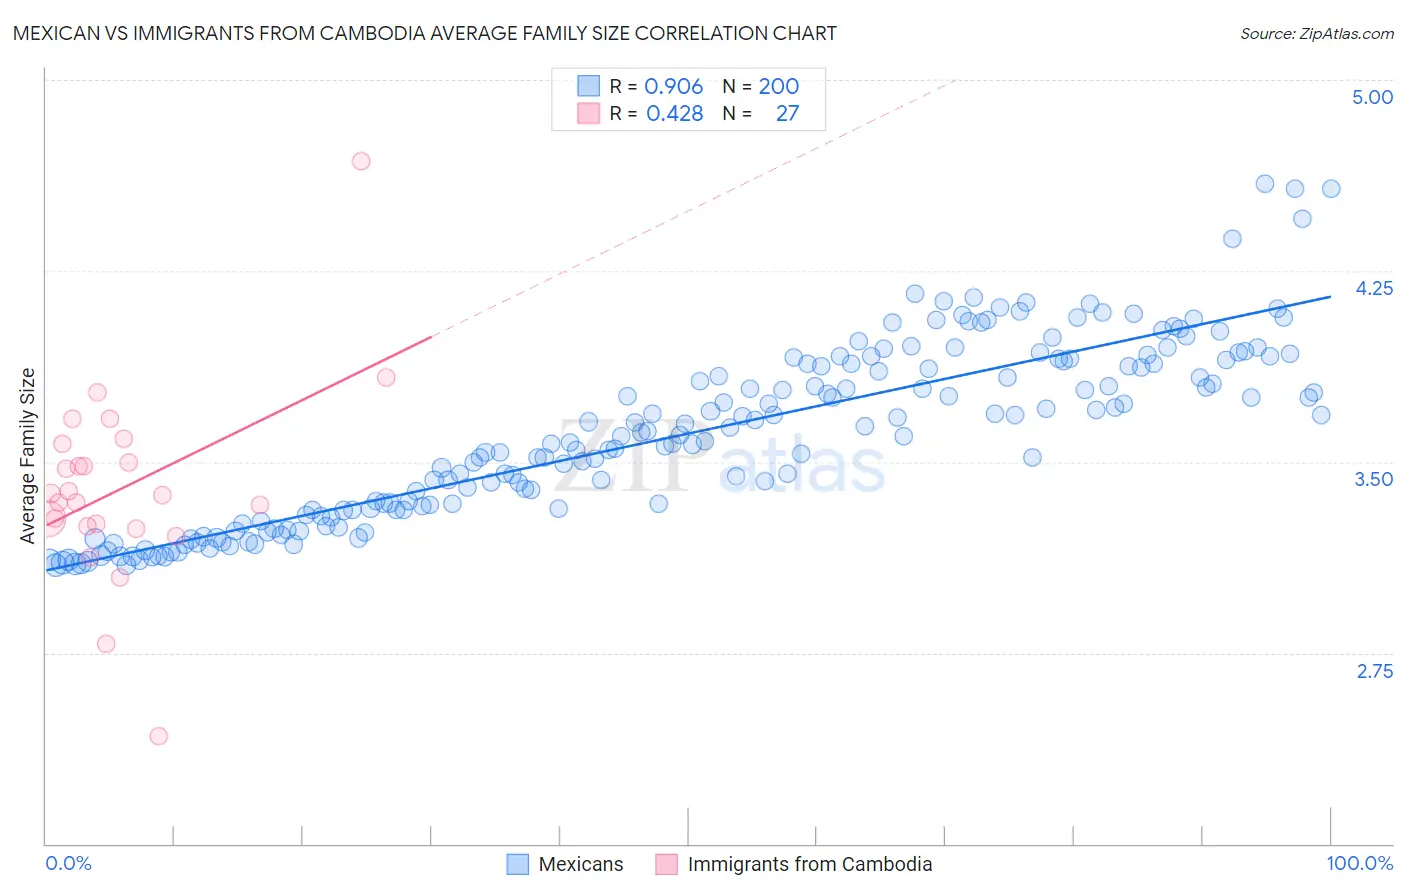
Mexican vs Immigrants from Cambodia Average Family Size Correlation Chart
The statistical analysis conducted on geographies consisting of 564,667,700 people shows a near-perfect positive correlation between the proportion of Mexicans and average family size in the United States with a correlation coefficient (R) of 0.906 and weighted average of 3.48. Similarly, the statistical analysis conducted on geographies consisting of 205,129,465 people shows a moderate positive correlation between the proportion of Immigrants from Cambodia and average family size in the United States with a correlation coefficient (R) of 0.428 and weighted average of 3.33, a difference of 4.3%.
Average Family Size Correlation Summary
| Measurement | Mexican | Immigrants from Cambodia |
| Minimum | 3.09 | 2.42 |
| Maximum | 4.59 | 4.68 |
| Range | 1.50 | 2.26 |
| Mean | 3.61 | 3.40 |
| Median | 3.60 | 3.37 |
| Interquartile 25% (IQ1) | 3.31 | 3.25 |
| Interquartile 75% (IQ3) | 3.89 | 3.57 |
| Interquartile Range (IQR) | 0.58 | 0.32 |
| Standard Deviation (Sample) | 0.34 | 0.39 |
| Standard Deviation (Population) | 0.34 | 0.38 |
Similar Demographics by Average Family Size
Demographics Similar to Mexicans by Average Family Size
In terms of average family size, the demographic groups most similar to Mexicans are Cheyenne (3.47, a difference of 0.040%), Salvadoran (3.48, a difference of 0.070%), Yuman (3.47, a difference of 0.30%), Immigrants from El Salvador (3.49, a difference of 0.32%), and Apache (3.46, a difference of 0.35%).
| Demographics | Rating | Rank | Average Family Size |
| Immigrants | Mexico | 100.0 /100 | #12 | Exceptional 3.52 |
| Sioux | 100.0 /100 | #13 | Exceptional 3.52 |
| Immigrants | Central America | 100.0 /100 | #14 | Exceptional 3.49 |
| Tongans | 100.0 /100 | #15 | Exceptional 3.49 |
| Ute | 100.0 /100 | #16 | Exceptional 3.49 |
| Immigrants | El Salvador | 100.0 /100 | #17 | Exceptional 3.49 |
| Salvadorans | 100.0 /100 | #18 | Exceptional 3.48 |
| Mexicans | 100.0 /100 | #19 | Exceptional 3.48 |
| Cheyenne | 100.0 /100 | #20 | Exceptional 3.47 |
| Yuman | 100.0 /100 | #21 | Exceptional 3.47 |
| Apache | 100.0 /100 | #22 | Exceptional 3.46 |
| Immigrants | Fiji | 100.0 /100 | #23 | Exceptional 3.45 |
| Natives/Alaskans | 100.0 /100 | #24 | Exceptional 3.45 |
| Yakama | 100.0 /100 | #25 | Exceptional 3.45 |
| Native Hawaiians | 100.0 /100 | #26 | Exceptional 3.43 |
Demographics Similar to Immigrants from Cambodia by Average Family Size
In terms of average family size, the demographic groups most similar to Immigrants from Cambodia are Immigrants (3.33, a difference of 0.030%), Immigrants from Jamaica (3.33, a difference of 0.080%), Immigrants from Trinidad and Tobago (3.33, a difference of 0.080%), Immigrants from West Indies (3.33, a difference of 0.090%), and Immigrants from St. Vincent and the Grenadines (3.34, a difference of 0.12%).
| Demographics | Rating | Rank | Average Family Size |
| Central American Indians | 100.0 /100 | #61 | Exceptional 3.35 |
| Immigrants | Grenada | 100.0 /100 | #62 | Exceptional 3.34 |
| Chinese | 100.0 /100 | #63 | Exceptional 3.34 |
| Dominicans | 99.9 /100 | #64 | Exceptional 3.34 |
| Immigrants | Laos | 99.9 /100 | #65 | Exceptional 3.34 |
| Immigrants | St. Vincent and the Grenadines | 99.9 /100 | #66 | Exceptional 3.34 |
| Immigrants | Jamaica | 99.9 /100 | #67 | Exceptional 3.33 |
| Immigrants | Cambodia | 99.9 /100 | #68 | Exceptional 3.33 |
| Immigrants | Immigrants | 99.9 /100 | #69 | Exceptional 3.33 |
| Immigrants | Trinidad and Tobago | 99.9 /100 | #70 | Exceptional 3.33 |
| Immigrants | West Indies | 99.9 /100 | #71 | Exceptional 3.33 |
| Immigrants | Caribbean | 99.9 /100 | #72 | Exceptional 3.33 |
| Yaqui | 99.9 /100 | #73 | Exceptional 3.32 |
| Immigrants | Sierra Leone | 99.9 /100 | #74 | Exceptional 3.32 |
| Immigrants | Barbados | 99.8 /100 | #75 | Exceptional 3.32 |