German vs Immigrants from Cambodia In Labor Force | Age 20-24
COMPARE
German
Immigrants from Cambodia
In Labor Force | Age 20-24
In Labor Force | Age 20-24 Comparison
Germans
Immigrants from Cambodia
78.6%
IN LABOR FORCE | AGE 20-24
100.0/ 100
METRIC RATING
12th/ 347
METRIC RANK
75.4%
IN LABOR FORCE | AGE 20-24
76.7/ 100
METRIC RATING
148th/ 347
METRIC RANK
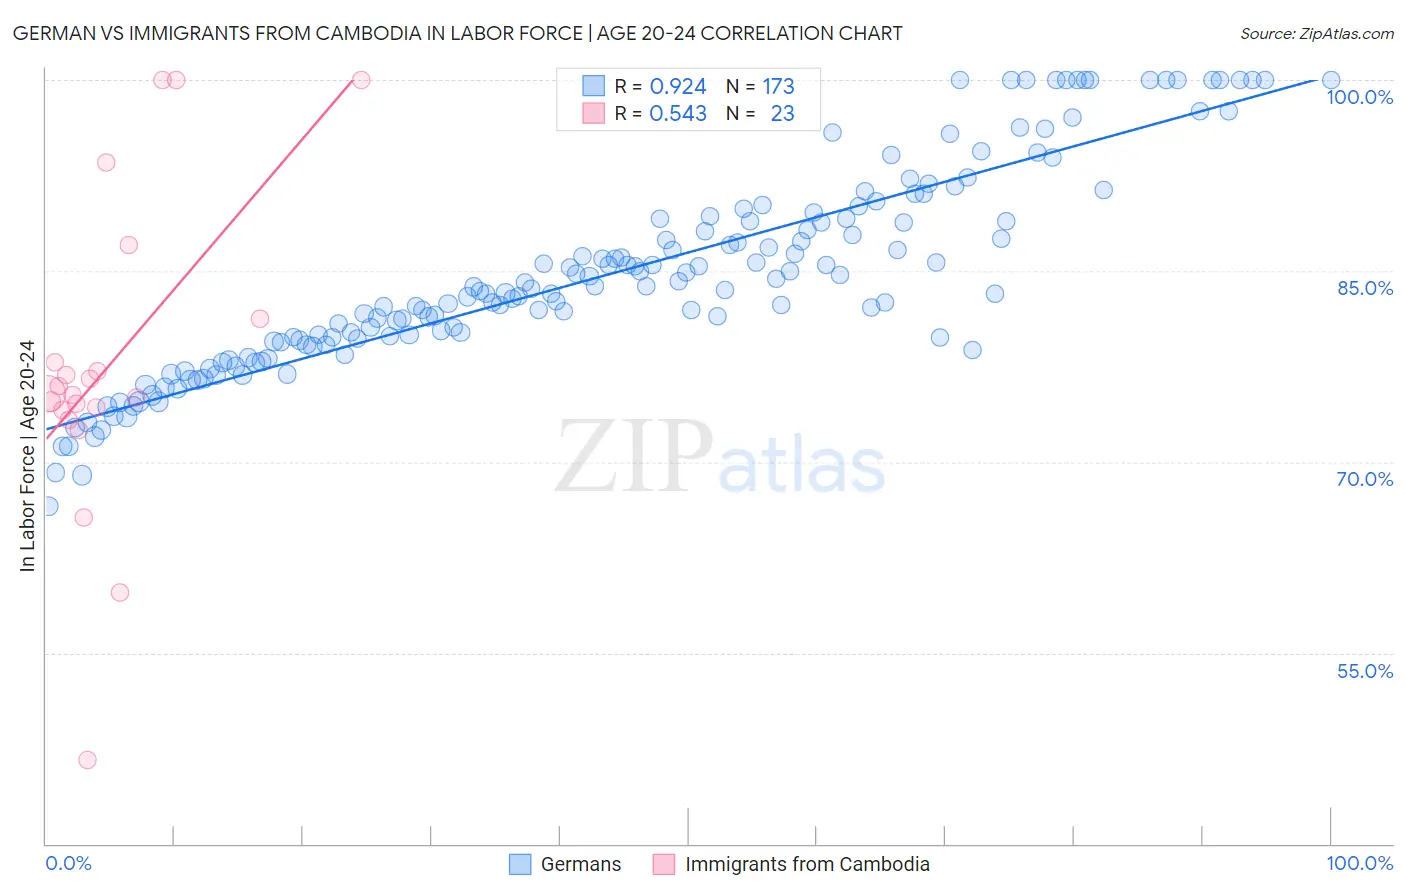
German vs Immigrants from Cambodia In Labor Force | Age 20-24 Correlation Chart
The statistical analysis conducted on geographies consisting of 578,744,060 people shows a near-perfect positive correlation between the proportion of Germans and labor force participation rate among population between the ages 20 and 24 in the United States with a correlation coefficient (R) of 0.924 and weighted average of 78.6%. Similarly, the statistical analysis conducted on geographies consisting of 205,146,511 people shows a substantial positive correlation between the proportion of Immigrants from Cambodia and labor force participation rate among population between the ages 20 and 24 in the United States with a correlation coefficient (R) of 0.543 and weighted average of 75.4%, a difference of 4.3%.
In Labor Force | Age 20-24 Correlation Summary
| Measurement | German | Immigrants from Cambodia |
| Minimum | 66.5% | 46.5% |
| Maximum | 100.0% | 100.0% |
| Range | 33.5% | 53.5% |
| Mean | 84.7% | 77.7% |
| Median | 83.6% | 75.4% |
| Interquartile 25% (IQ1) | 79.5% | 74.1% |
| Interquartile 75% (IQ3) | 89.1% | 81.2% |
| Interquartile Range (IQR) | 9.6% | 7.1% |
| Standard Deviation (Sample) | 7.8% | 12.4% |
| Standard Deviation (Population) | 7.8% | 12.1% |
Similar Demographics by In Labor Force | Age 20-24
Demographics Similar to Germans by In Labor Force | Age 20-24
In terms of in labor force | age 20-24, the demographic groups most similar to Germans are Scandinavian (78.5%, a difference of 0.070%), Czech (78.5%, a difference of 0.070%), Finnish (78.7%, a difference of 0.11%), Slovene (78.7%, a difference of 0.15%), and Sudanese (78.4%, a difference of 0.21%).
| Demographics | Rating | Rank | In Labor Force | Age 20-24 |
| Aleuts | 100.0 /100 | #5 | Exceptional 79.0% |
| Danes | 100.0 /100 | #6 | Exceptional 79.0% |
| Luxembourgers | 100.0 /100 | #7 | Exceptional 79.0% |
| Immigrants | Cabo Verde | 100.0 /100 | #8 | Exceptional 78.9% |
| Swedes | 100.0 /100 | #9 | Exceptional 78.8% |
| Slovenes | 100.0 /100 | #10 | Exceptional 78.7% |
| Finns | 100.0 /100 | #11 | Exceptional 78.7% |
| Germans | 100.0 /100 | #12 | Exceptional 78.6% |
| Scandinavians | 100.0 /100 | #13 | Exceptional 78.5% |
| Czechs | 100.0 /100 | #14 | Exceptional 78.5% |
| Sudanese | 100.0 /100 | #15 | Exceptional 78.4% |
| Dutch | 100.0 /100 | #16 | Exceptional 78.4% |
| Cape Verdeans | 100.0 /100 | #17 | Exceptional 78.3% |
| Immigrants | Bosnia and Herzegovina | 100.0 /100 | #18 | Exceptional 78.1% |
| Bangladeshis | 100.0 /100 | #19 | Exceptional 78.1% |
Demographics Similar to Immigrants from Cambodia by In Labor Force | Age 20-24
In terms of in labor force | age 20-24, the demographic groups most similar to Immigrants from Cambodia are Ugandan (75.4%, a difference of 0.010%), Comanche (75.4%, a difference of 0.020%), Mexican American Indian (75.4%, a difference of 0.040%), Salvadoran (75.3%, a difference of 0.040%), and Paiute (75.3%, a difference of 0.050%).
| Demographics | Rating | Rank | In Labor Force | Age 20-24 |
| Romanians | 84.1 /100 | #141 | Excellent 75.5% |
| Blackfeet | 83.6 /100 | #142 | Excellent 75.5% |
| Spaniards | 82.0 /100 | #143 | Excellent 75.5% |
| Bhutanese | 80.8 /100 | #144 | Excellent 75.4% |
| Koreans | 79.7 /100 | #145 | Good 75.4% |
| Mexican American Indians | 78.8 /100 | #146 | Good 75.4% |
| Comanche | 77.6 /100 | #147 | Good 75.4% |
| Immigrants | Cambodia | 76.7 /100 | #148 | Good 75.4% |
| Ugandans | 76.1 /100 | #149 | Good 75.4% |
| Salvadorans | 74.8 /100 | #150 | Good 75.3% |
| Paiute | 74.1 /100 | #151 | Good 75.3% |
| Lebanese | 73.5 /100 | #152 | Good 75.3% |
| Guatemalans | 72.3 /100 | #153 | Good 75.3% |
| Osage | 72.3 /100 | #154 | Good 75.3% |
| Immigrants | Guatemala | 71.9 /100 | #155 | Good 75.3% |