Immigrants from Cabo Verde vs Immigrants from St. Vincent and the Grenadines In Labor Force | Age 35-44
COMPARE
Immigrants from Cabo Verde
Immigrants from St. Vincent and the Grenadines
In Labor Force | Age 35-44
In Labor Force | Age 35-44 Comparison
Immigrants from Cabo Verde
Immigrants from St. Vincent and the Grenadines
86.2%
IN LABOR FORCE | AGE 35-44
100.0/ 100
METRIC RATING
4th/ 347
METRIC RANK
83.7%
IN LABOR FORCE | AGE 35-44
0.7/ 100
METRIC RATING
249th/ 347
METRIC RANK
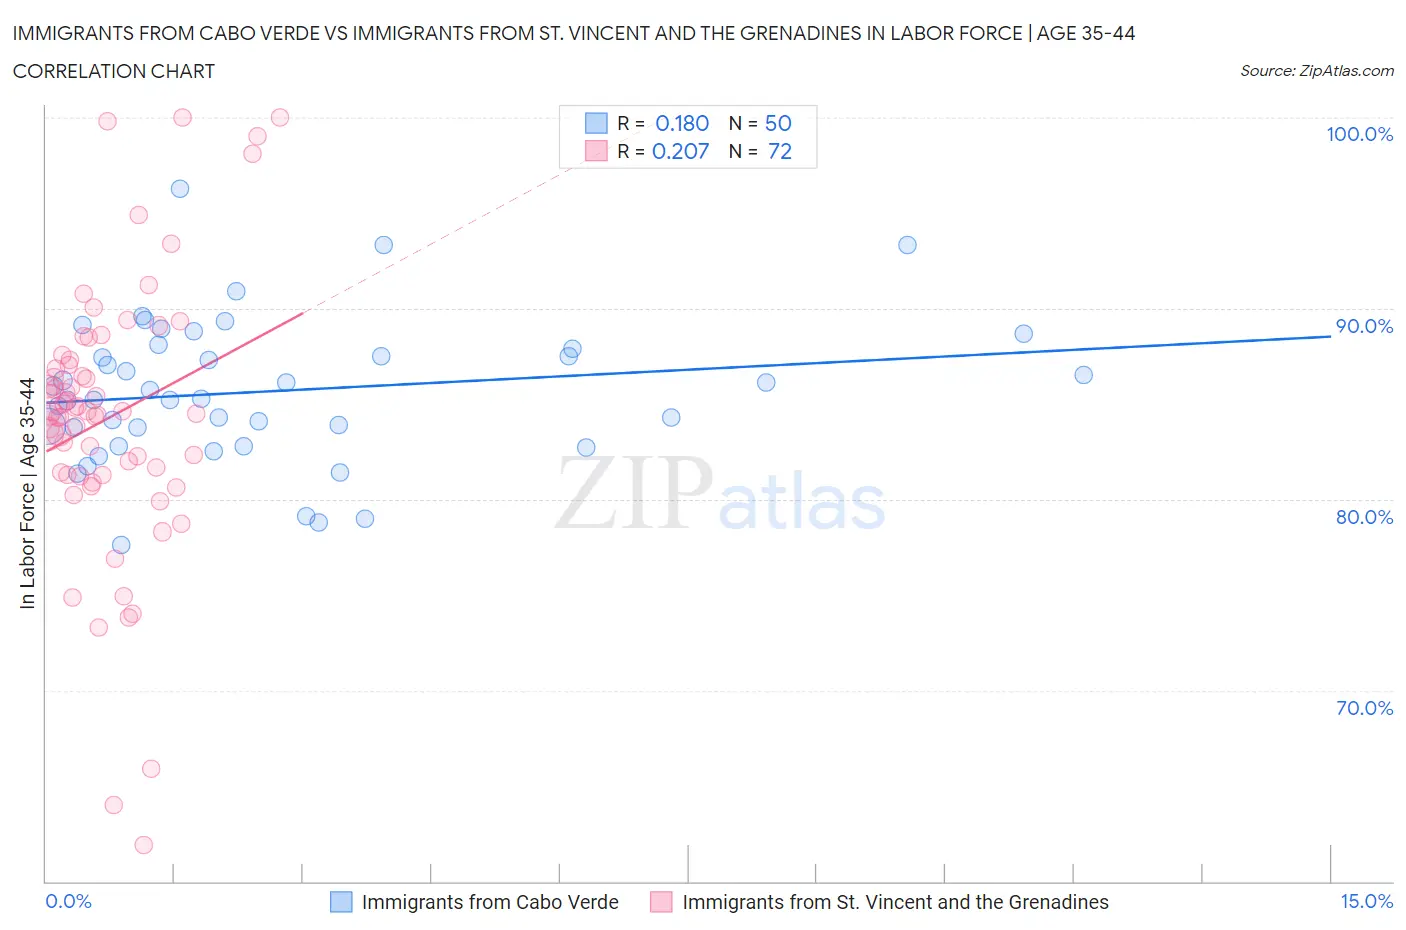
Immigrants from Cabo Verde vs Immigrants from St. Vincent and the Grenadines In Labor Force | Age 35-44 Correlation Chart
The statistical analysis conducted on geographies consisting of 38,133,227 people shows a poor positive correlation between the proportion of Immigrants from Cabo Verde and labor force participation rate among population between the ages 35 and 44 in the United States with a correlation coefficient (R) of 0.180 and weighted average of 86.2%. Similarly, the statistical analysis conducted on geographies consisting of 56,188,322 people shows a weak positive correlation between the proportion of Immigrants from St. Vincent and the Grenadines and labor force participation rate among population between the ages 35 and 44 in the United States with a correlation coefficient (R) of 0.207 and weighted average of 83.7%, a difference of 3.0%.
In Labor Force | Age 35-44 Correlation Summary
| Measurement | Immigrants from Cabo Verde | Immigrants from St. Vincent and the Grenadines |
| Minimum | 77.6% | 61.9% |
| Maximum | 96.3% | 100.0% |
| Range | 18.7% | 38.1% |
| Mean | 85.7% | 84.2% |
| Median | 85.5% | 84.5% |
| Interquartile 25% (IQ1) | 83.8% | 81.3% |
| Interquartile 75% (IQ3) | 87.9% | 87.2% |
| Interquartile Range (IQR) | 4.1% | 5.9% |
| Standard Deviation (Sample) | 3.8% | 7.2% |
| Standard Deviation (Population) | 3.7% | 7.1% |
Similar Demographics by In Labor Force | Age 35-44
Demographics Similar to Immigrants from Cabo Verde by In Labor Force | Age 35-44
In terms of in labor force | age 35-44, the demographic groups most similar to Immigrants from Cabo Verde are Immigrants from Bolivia (86.2%, a difference of 0.030%), Zimbabwean (86.1%, a difference of 0.13%), Bolivian (86.1%, a difference of 0.14%), Immigrants from Sierra Leone (86.1%, a difference of 0.18%), and Luxembourger (86.4%, a difference of 0.22%).
| Demographics | Rating | Rank | In Labor Force | Age 35-44 |
| Sierra Leoneans | 100.0 /100 | #1 | Exceptional 86.4% |
| Luxembourgers | 100.0 /100 | #2 | Exceptional 86.4% |
| Immigrants | Bolivia | 100.0 /100 | #3 | Exceptional 86.2% |
| Immigrants | Cabo Verde | 100.0 /100 | #4 | Exceptional 86.2% |
| Zimbabweans | 100.0 /100 | #5 | Exceptional 86.1% |
| Bolivians | 100.0 /100 | #6 | Exceptional 86.1% |
| Immigrants | Sierra Leone | 100.0 /100 | #7 | Exceptional 86.1% |
| Immigrants | Ethiopia | 100.0 /100 | #8 | Exceptional 85.9% |
| Ethiopians | 100.0 /100 | #9 | Exceptional 85.9% |
| Cape Verdeans | 100.0 /100 | #10 | Exceptional 85.8% |
| Immigrants | Cameroon | 100.0 /100 | #11 | Exceptional 85.8% |
| Liberians | 100.0 /100 | #12 | Exceptional 85.7% |
| Somalis | 100.0 /100 | #13 | Exceptional 85.6% |
| Immigrants | Somalia | 100.0 /100 | #14 | Exceptional 85.6% |
| Norwegians | 100.0 /100 | #15 | Exceptional 85.6% |
Demographics Similar to Immigrants from St. Vincent and the Grenadines by In Labor Force | Age 35-44
In terms of in labor force | age 35-44, the demographic groups most similar to Immigrants from St. Vincent and the Grenadines are Indonesian (83.7%, a difference of 0.030%), Immigrants from Armenia (83.7%, a difference of 0.040%), Immigrants (83.7%, a difference of 0.060%), White/Caucasian (83.6%, a difference of 0.060%), and Salvadoran (83.6%, a difference of 0.070%).
| Demographics | Rating | Rank | In Labor Force | Age 35-44 |
| Immigrants | Cambodia | 1.1 /100 | #242 | Tragic 83.8% |
| Immigrants | Western Asia | 1.1 /100 | #243 | Tragic 83.8% |
| Guyanese | 1.1 /100 | #244 | Tragic 83.8% |
| Malaysians | 1.1 /100 | #245 | Tragic 83.8% |
| Immigrants | Immigrants | 1.0 /100 | #246 | Tragic 83.7% |
| Immigrants | Armenia | 0.9 /100 | #247 | Tragic 83.7% |
| Indonesians | 0.8 /100 | #248 | Tragic 83.7% |
| Immigrants | St. Vincent and the Grenadines | 0.7 /100 | #249 | Tragic 83.7% |
| Whites/Caucasians | 0.5 /100 | #250 | Tragic 83.6% |
| Salvadorans | 0.4 /100 | #251 | Tragic 83.6% |
| Immigrants | Guyana | 0.4 /100 | #252 | Tragic 83.6% |
| Lebanese | 0.4 /100 | #253 | Tragic 83.6% |
| Tongans | 0.4 /100 | #254 | Tragic 83.6% |
| Immigrants | Azores | 0.3 /100 | #255 | Tragic 83.6% |
| Japanese | 0.3 /100 | #256 | Tragic 83.6% |