Albanian vs Immigrants from St. Vincent and the Grenadines In Labor Force | Age 35-44
COMPARE
Albanian
Immigrants from St. Vincent and the Grenadines
In Labor Force | Age 35-44
In Labor Force | Age 35-44 Comparison
Albanians
Immigrants from St. Vincent and the Grenadines
85.1%
IN LABOR FORCE | AGE 35-44
99.4/ 100
METRIC RATING
60th/ 347
METRIC RANK
83.7%
IN LABOR FORCE | AGE 35-44
0.7/ 100
METRIC RATING
249th/ 347
METRIC RANK
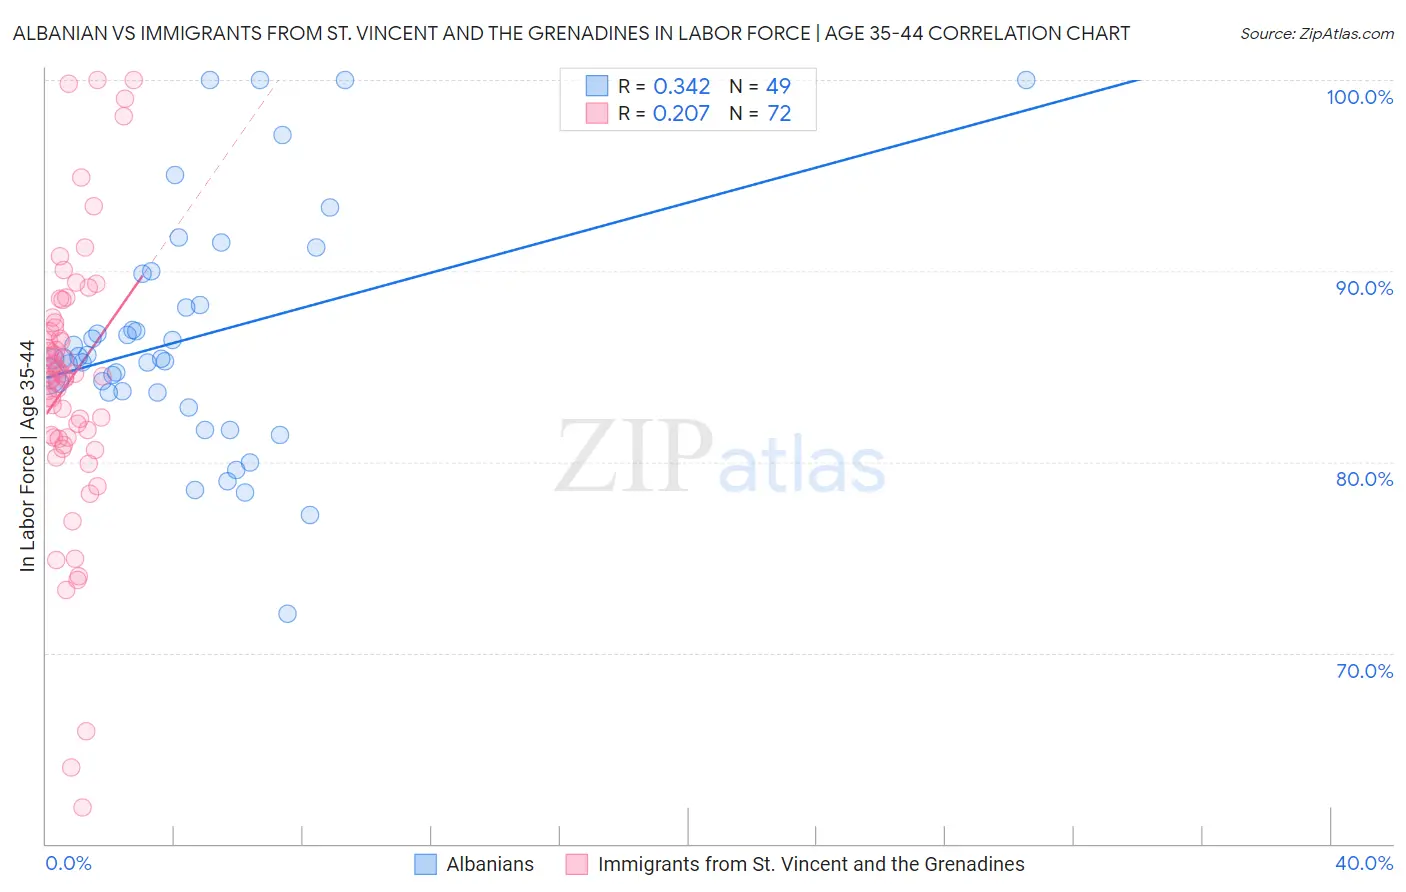
Albanian vs Immigrants from St. Vincent and the Grenadines In Labor Force | Age 35-44 Correlation Chart
The statistical analysis conducted on geographies consisting of 193,210,440 people shows a mild positive correlation between the proportion of Albanians and labor force participation rate among population between the ages 35 and 44 in the United States with a correlation coefficient (R) of 0.342 and weighted average of 85.1%. Similarly, the statistical analysis conducted on geographies consisting of 56,188,322 people shows a weak positive correlation between the proportion of Immigrants from St. Vincent and the Grenadines and labor force participation rate among population between the ages 35 and 44 in the United States with a correlation coefficient (R) of 0.207 and weighted average of 83.7%, a difference of 1.6%.
In Labor Force | Age 35-44 Correlation Summary
| Measurement | Albanian | Immigrants from St. Vincent and the Grenadines |
| Minimum | 72.1% | 61.9% |
| Maximum | 100.0% | 100.0% |
| Range | 27.9% | 38.1% |
| Mean | 86.4% | 84.2% |
| Median | 85.4% | 84.5% |
| Interquartile 25% (IQ1) | 83.6% | 81.3% |
| Interquartile 75% (IQ3) | 89.0% | 87.2% |
| Interquartile Range (IQR) | 5.4% | 5.9% |
| Standard Deviation (Sample) | 6.1% | 7.2% |
| Standard Deviation (Population) | 6.0% | 7.1% |
Similar Demographics by In Labor Force | Age 35-44
Demographics Similar to Albanians by In Labor Force | Age 35-44
In terms of in labor force | age 35-44, the demographic groups most similar to Albanians are Serbian (85.1%, a difference of 0.0%), Chinese (85.1%, a difference of 0.010%), Slovak (85.1%, a difference of 0.010%), Immigrants from Latvia (85.0%, a difference of 0.020%), and Immigrants from Moldova (85.0%, a difference of 0.020%).
| Demographics | Rating | Rank | In Labor Force | Age 35-44 |
| Taiwanese | 99.6 /100 | #53 | Exceptional 85.1% |
| Turks | 99.5 /100 | #54 | Exceptional 85.1% |
| Soviet Union | 99.5 /100 | #55 | Exceptional 85.1% |
| Immigrants | Croatia | 99.5 /100 | #56 | Exceptional 85.1% |
| Chinese | 99.4 /100 | #57 | Exceptional 85.1% |
| Slovaks | 99.4 /100 | #58 | Exceptional 85.1% |
| Serbians | 99.4 /100 | #59 | Exceptional 85.1% |
| Albanians | 99.4 /100 | #60 | Exceptional 85.1% |
| Immigrants | Latvia | 99.3 /100 | #61 | Exceptional 85.0% |
| Immigrants | Moldova | 99.3 /100 | #62 | Exceptional 85.0% |
| Immigrants | Uganda | 99.3 /100 | #63 | Exceptional 85.0% |
| Swedes | 99.2 /100 | #64 | Exceptional 85.0% |
| Immigrants | Brazil | 99.2 /100 | #65 | Exceptional 85.0% |
| Immigrants | Haiti | 99.1 /100 | #66 | Exceptional 85.0% |
| Immigrants | Italy | 99.1 /100 | #67 | Exceptional 85.0% |
Demographics Similar to Immigrants from St. Vincent and the Grenadines by In Labor Force | Age 35-44
In terms of in labor force | age 35-44, the demographic groups most similar to Immigrants from St. Vincent and the Grenadines are Indonesian (83.7%, a difference of 0.030%), Immigrants from Armenia (83.7%, a difference of 0.040%), Immigrants (83.7%, a difference of 0.060%), White/Caucasian (83.6%, a difference of 0.060%), and Salvadoran (83.6%, a difference of 0.070%).
| Demographics | Rating | Rank | In Labor Force | Age 35-44 |
| Immigrants | Cambodia | 1.1 /100 | #242 | Tragic 83.8% |
| Immigrants | Western Asia | 1.1 /100 | #243 | Tragic 83.8% |
| Guyanese | 1.1 /100 | #244 | Tragic 83.8% |
| Malaysians | 1.1 /100 | #245 | Tragic 83.8% |
| Immigrants | Immigrants | 1.0 /100 | #246 | Tragic 83.7% |
| Immigrants | Armenia | 0.9 /100 | #247 | Tragic 83.7% |
| Indonesians | 0.8 /100 | #248 | Tragic 83.7% |
| Immigrants | St. Vincent and the Grenadines | 0.7 /100 | #249 | Tragic 83.7% |
| Whites/Caucasians | 0.5 /100 | #250 | Tragic 83.6% |
| Salvadorans | 0.4 /100 | #251 | Tragic 83.6% |
| Immigrants | Guyana | 0.4 /100 | #252 | Tragic 83.6% |
| Lebanese | 0.4 /100 | #253 | Tragic 83.6% |
| Tongans | 0.4 /100 | #254 | Tragic 83.6% |
| Immigrants | Azores | 0.3 /100 | #255 | Tragic 83.6% |
| Japanese | 0.3 /100 | #256 | Tragic 83.6% |