Immigrants from Switzerland vs Immigrants from St. Vincent and the Grenadines In Labor Force | Age 35-44
COMPARE
Immigrants from Switzerland
Immigrants from St. Vincent and the Grenadines
In Labor Force | Age 35-44
In Labor Force | Age 35-44 Comparison
Immigrants from Switzerland
Immigrants from St. Vincent and the Grenadines
84.5%
IN LABOR FORCE | AGE 35-44
65.9/ 100
METRIC RATING
155th/ 347
METRIC RANK
83.7%
IN LABOR FORCE | AGE 35-44
0.7/ 100
METRIC RATING
249th/ 347
METRIC RANK
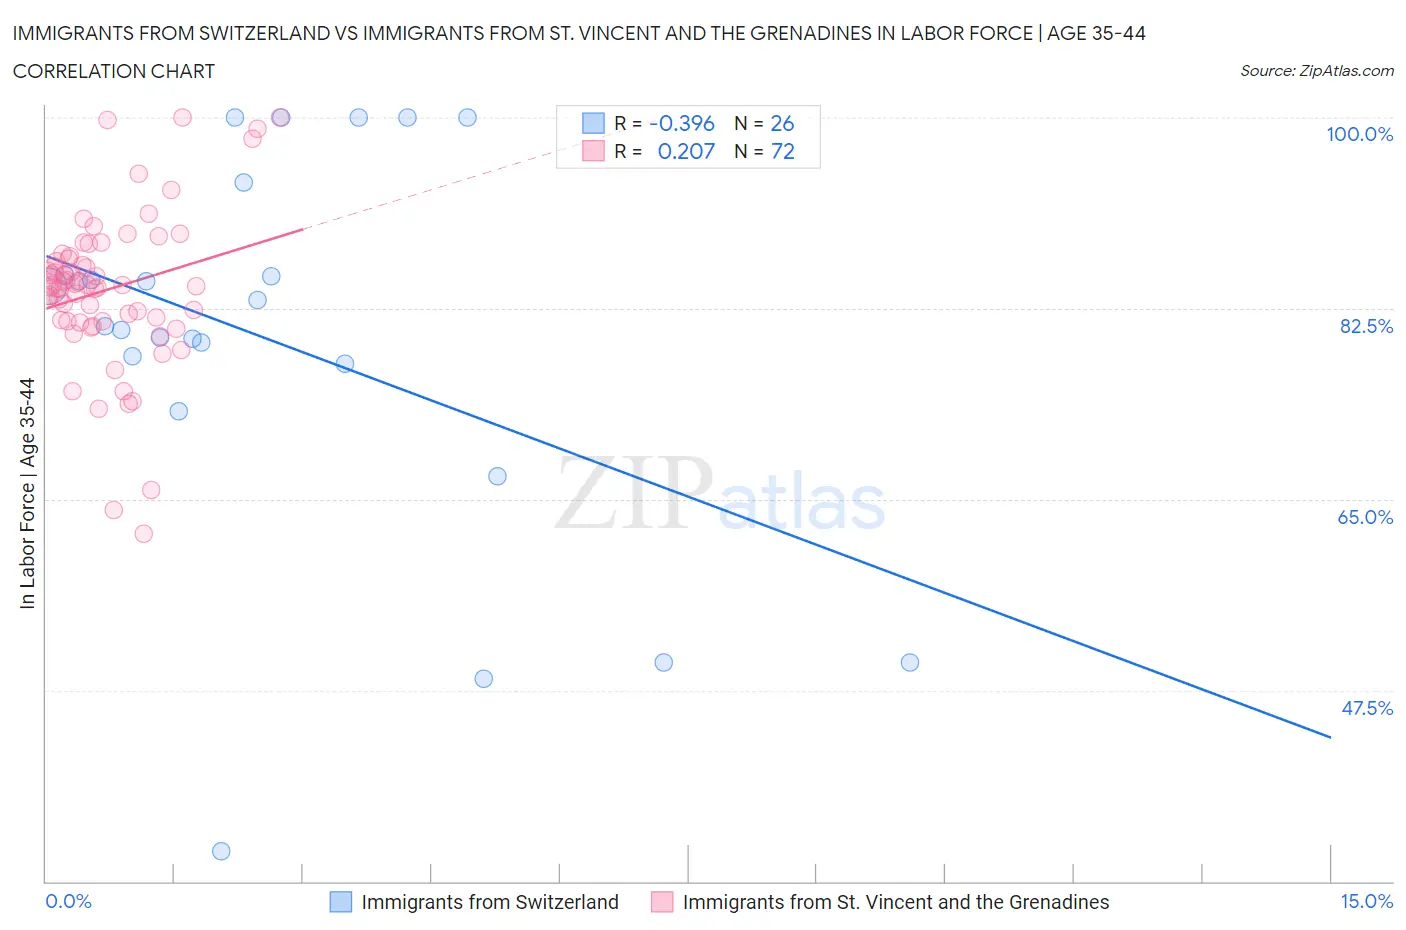
Immigrants from Switzerland vs Immigrants from St. Vincent and the Grenadines In Labor Force | Age 35-44 Correlation Chart
The statistical analysis conducted on geographies consisting of 148,071,770 people shows a mild negative correlation between the proportion of Immigrants from Switzerland and labor force participation rate among population between the ages 35 and 44 in the United States with a correlation coefficient (R) of -0.396 and weighted average of 84.5%. Similarly, the statistical analysis conducted on geographies consisting of 56,188,322 people shows a weak positive correlation between the proportion of Immigrants from St. Vincent and the Grenadines and labor force participation rate among population between the ages 35 and 44 in the United States with a correlation coefficient (R) of 0.207 and weighted average of 83.7%, a difference of 0.92%.
In Labor Force | Age 35-44 Correlation Summary
| Measurement | Immigrants from Switzerland | Immigrants from St. Vincent and the Grenadines |
| Minimum | 32.7% | 61.9% |
| Maximum | 100.0% | 100.0% |
| Range | 67.3% | 38.1% |
| Mean | 79.4% | 84.2% |
| Median | 82.1% | 84.5% |
| Interquartile 25% (IQ1) | 77.4% | 81.3% |
| Interquartile 75% (IQ3) | 85.5% | 87.2% |
| Interquartile Range (IQR) | 8.1% | 5.9% |
| Standard Deviation (Sample) | 17.4% | 7.2% |
| Standard Deviation (Population) | 17.1% | 7.1% |
Similar Demographics by In Labor Force | Age 35-44
Demographics Similar to Immigrants from Switzerland by In Labor Force | Age 35-44
In terms of in labor force | age 35-44, the demographic groups most similar to Immigrants from Switzerland are Immigrants from Israel (84.4%, a difference of 0.010%), Immigrants from Austria (84.4%, a difference of 0.010%), Jamaican (84.4%, a difference of 0.020%), Trinidadian and Tobagonian (84.5%, a difference of 0.030%), and Iranian (84.5%, a difference of 0.030%).
| Demographics | Rating | Rank | In Labor Force | Age 35-44 |
| South American Indians | 73.6 /100 | #148 | Good 84.5% |
| Okinawans | 73.5 /100 | #149 | Good 84.5% |
| Immigrants | Nigeria | 73.3 /100 | #150 | Good 84.5% |
| Romanians | 72.1 /100 | #151 | Good 84.5% |
| Immigrants | Taiwan | 71.4 /100 | #152 | Good 84.5% |
| Trinidadians and Tobagonians | 69.5 /100 | #153 | Good 84.5% |
| Iranians | 69.4 /100 | #154 | Good 84.5% |
| Immigrants | Switzerland | 65.9 /100 | #155 | Good 84.5% |
| Immigrants | Israel | 64.3 /100 | #156 | Good 84.4% |
| Immigrants | Austria | 63.8 /100 | #157 | Good 84.4% |
| Jamaicans | 62.7 /100 | #158 | Good 84.4% |
| Immigrants | Senegal | 60.4 /100 | #159 | Good 84.4% |
| Immigrants | Kazakhstan | 60.4 /100 | #160 | Good 84.4% |
| Immigrants | Venezuela | 60.0 /100 | #161 | Good 84.4% |
| Immigrants | Hungary | 59.4 /100 | #162 | Average 84.4% |
Demographics Similar to Immigrants from St. Vincent and the Grenadines by In Labor Force | Age 35-44
In terms of in labor force | age 35-44, the demographic groups most similar to Immigrants from St. Vincent and the Grenadines are Indonesian (83.7%, a difference of 0.030%), Immigrants from Armenia (83.7%, a difference of 0.040%), Immigrants (83.7%, a difference of 0.060%), White/Caucasian (83.6%, a difference of 0.060%), and Salvadoran (83.6%, a difference of 0.070%).
| Demographics | Rating | Rank | In Labor Force | Age 35-44 |
| Immigrants | Cambodia | 1.1 /100 | #242 | Tragic 83.8% |
| Immigrants | Western Asia | 1.1 /100 | #243 | Tragic 83.8% |
| Guyanese | 1.1 /100 | #244 | Tragic 83.8% |
| Malaysians | 1.1 /100 | #245 | Tragic 83.8% |
| Immigrants | Immigrants | 1.0 /100 | #246 | Tragic 83.7% |
| Immigrants | Armenia | 0.9 /100 | #247 | Tragic 83.7% |
| Indonesians | 0.8 /100 | #248 | Tragic 83.7% |
| Immigrants | St. Vincent and the Grenadines | 0.7 /100 | #249 | Tragic 83.7% |
| Whites/Caucasians | 0.5 /100 | #250 | Tragic 83.6% |
| Salvadorans | 0.4 /100 | #251 | Tragic 83.6% |
| Immigrants | Guyana | 0.4 /100 | #252 | Tragic 83.6% |
| Lebanese | 0.4 /100 | #253 | Tragic 83.6% |
| Tongans | 0.4 /100 | #254 | Tragic 83.6% |
| Immigrants | Azores | 0.3 /100 | #255 | Tragic 83.6% |
| Japanese | 0.3 /100 | #256 | Tragic 83.6% |