Immigrants from Bosnia and Herzegovina vs Chickasaw In Labor Force | Age 35-44
COMPARE
Immigrants from Bosnia and Herzegovina
Chickasaw
In Labor Force | Age 35-44
In Labor Force | Age 35-44 Comparison
Immigrants from Bosnia and Herzegovina
Chickasaw
85.4%
IN LABOR FORCE | AGE 35-44
100.0/ 100
METRIC RATING
22nd/ 347
METRIC RANK
80.9%
IN LABOR FORCE | AGE 35-44
0.0/ 100
METRIC RATING
320th/ 347
METRIC RANK
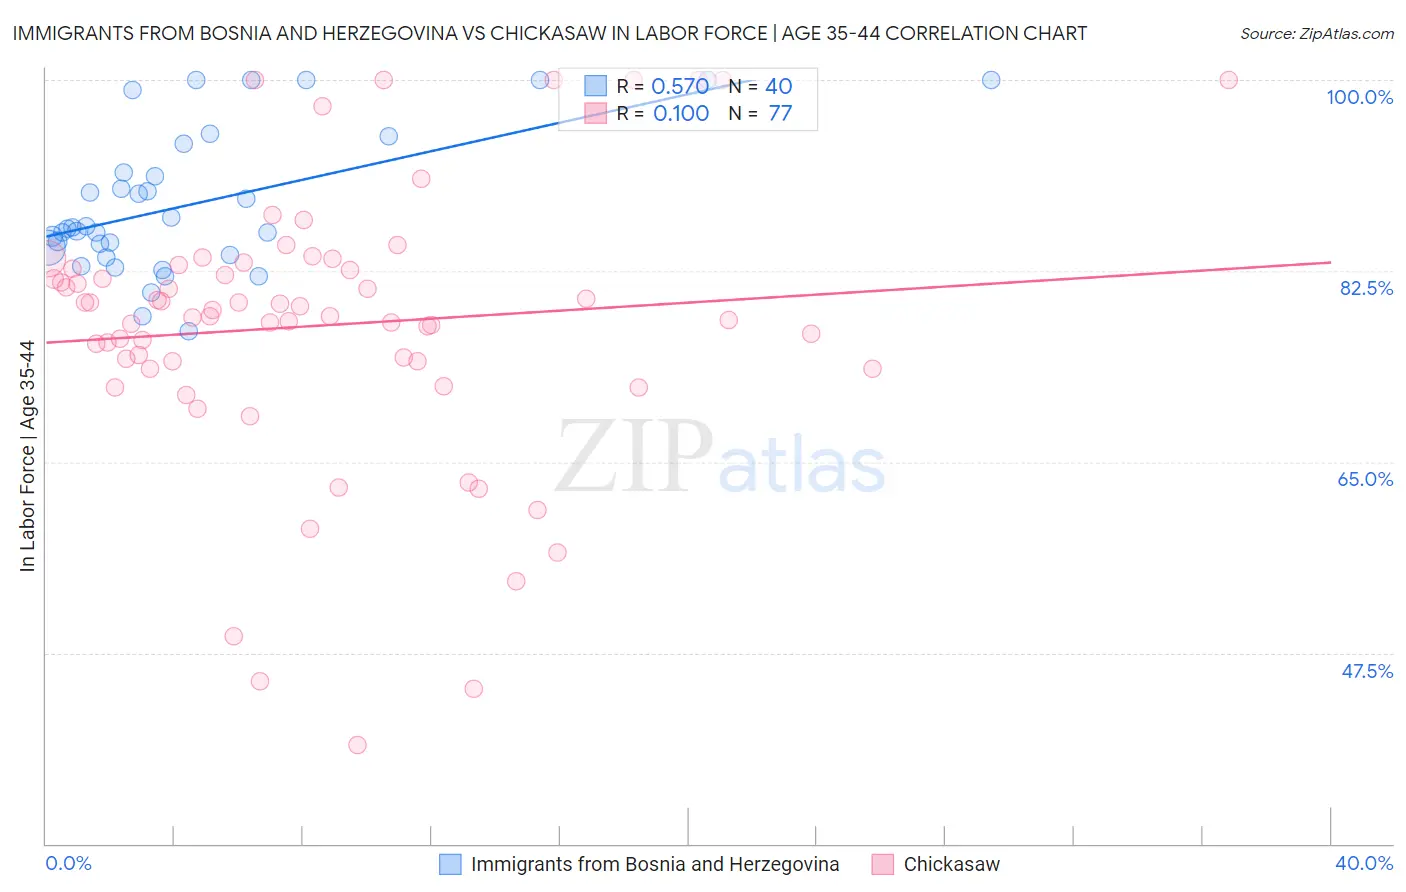
Immigrants from Bosnia and Herzegovina vs Chickasaw In Labor Force | Age 35-44 Correlation Chart
The statistical analysis conducted on geographies consisting of 156,807,343 people shows a substantial positive correlation between the proportion of Immigrants from Bosnia and Herzegovina and labor force participation rate among population between the ages 35 and 44 in the United States with a correlation coefficient (R) of 0.570 and weighted average of 85.4%. Similarly, the statistical analysis conducted on geographies consisting of 147,707,163 people shows a slight positive correlation between the proportion of Chickasaw and labor force participation rate among population between the ages 35 and 44 in the United States with a correlation coefficient (R) of 0.100 and weighted average of 80.9%, a difference of 5.6%.
In Labor Force | Age 35-44 Correlation Summary
| Measurement | Immigrants from Bosnia and Herzegovina | Chickasaw |
| Minimum | 76.9% | 39.0% |
| Maximum | 100.0% | 100.0% |
| Range | 23.1% | 61.0% |
| Mean | 88.7% | 77.5% |
| Median | 86.4% | 78.4% |
| Interquartile 25% (IQ1) | 84.3% | 73.9% |
| Interquartile 75% (IQ3) | 92.8% | 82.9% |
| Interquartile Range (IQR) | 8.6% | 9.0% |
| Standard Deviation (Sample) | 6.5% | 12.5% |
| Standard Deviation (Population) | 6.5% | 12.5% |
Similar Demographics by In Labor Force | Age 35-44
Demographics Similar to Immigrants from Bosnia and Herzegovina by In Labor Force | Age 35-44
In terms of in labor force | age 35-44, the demographic groups most similar to Immigrants from Bosnia and Herzegovina are Immigrants from Eastern Africa (85.4%, a difference of 0.020%), Bulgarian (85.5%, a difference of 0.040%), Latvian (85.4%, a difference of 0.080%), Paraguayan (85.4%, a difference of 0.090%), and Immigrants from Liberia (85.4%, a difference of 0.090%).
| Demographics | Rating | Rank | In Labor Force | Age 35-44 |
| Norwegians | 100.0 /100 | #15 | Exceptional 85.6% |
| Immigrants | Ireland | 100.0 /100 | #16 | Exceptional 85.6% |
| Immigrants | North Macedonia | 100.0 /100 | #17 | Exceptional 85.6% |
| Carpatho Rusyns | 100.0 /100 | #18 | Exceptional 85.6% |
| Slovenes | 100.0 /100 | #19 | Exceptional 85.6% |
| Immigrants | Serbia | 100.0 /100 | #20 | Exceptional 85.5% |
| Bulgarians | 100.0 /100 | #21 | Exceptional 85.5% |
| Immigrants | Bosnia and Herzegovina | 100.0 /100 | #22 | Exceptional 85.4% |
| Immigrants | Eastern Africa | 100.0 /100 | #23 | Exceptional 85.4% |
| Latvians | 99.9 /100 | #24 | Exceptional 85.4% |
| Paraguayans | 99.9 /100 | #25 | Exceptional 85.4% |
| Immigrants | Liberia | 99.9 /100 | #26 | Exceptional 85.4% |
| Immigrants | Lithuania | 99.9 /100 | #27 | Exceptional 85.4% |
| Immigrants | Greece | 99.9 /100 | #28 | Exceptional 85.3% |
| Cambodians | 99.9 /100 | #29 | Exceptional 85.3% |
Demographics Similar to Chickasaw by In Labor Force | Age 35-44
In terms of in labor force | age 35-44, the demographic groups most similar to Chickasaw are Inupiat (80.9%, a difference of 0.050%), Puerto Rican (80.7%, a difference of 0.28%), Paiute (80.6%, a difference of 0.35%), Yaqui (80.5%, a difference of 0.46%), and Choctaw (80.5%, a difference of 0.47%).
| Demographics | Rating | Rank | In Labor Force | Age 35-44 |
| Mexicans | 0.0 /100 | #313 | Tragic 81.6% |
| Cajuns | 0.0 /100 | #314 | Tragic 81.5% |
| Immigrants | Mexico | 0.0 /100 | #315 | Tragic 81.5% |
| Comanche | 0.0 /100 | #316 | Tragic 81.5% |
| Cherokee | 0.0 /100 | #317 | Tragic 81.4% |
| Alaskan Athabascans | 0.0 /100 | #318 | Tragic 81.3% |
| Inupiat | 0.0 /100 | #319 | Tragic 80.9% |
| Chickasaw | 0.0 /100 | #320 | Tragic 80.9% |
| Puerto Ricans | 0.0 /100 | #321 | Tragic 80.7% |
| Paiute | 0.0 /100 | #322 | Tragic 80.6% |
| Yaqui | 0.0 /100 | #323 | Tragic 80.5% |
| Choctaw | 0.0 /100 | #324 | Tragic 80.5% |
| Dutch West Indians | 0.0 /100 | #325 | Tragic 80.4% |
| Seminole | 0.0 /100 | #326 | Tragic 80.4% |
| Sioux | 0.0 /100 | #327 | Tragic 80.2% |