Luxembourger vs Colombian In Labor Force | Age 35-44
COMPARE
Luxembourger
Colombian
In Labor Force | Age 35-44
In Labor Force | Age 35-44 Comparison
Luxembourgers
Colombians
86.4%
IN LABOR FORCE | AGE 35-44
100.0/ 100
METRIC RATING
2nd/ 347
METRIC RANK
85.0%
IN LABOR FORCE | AGE 35-44
98.8/ 100
METRIC RATING
74th/ 347
METRIC RANK
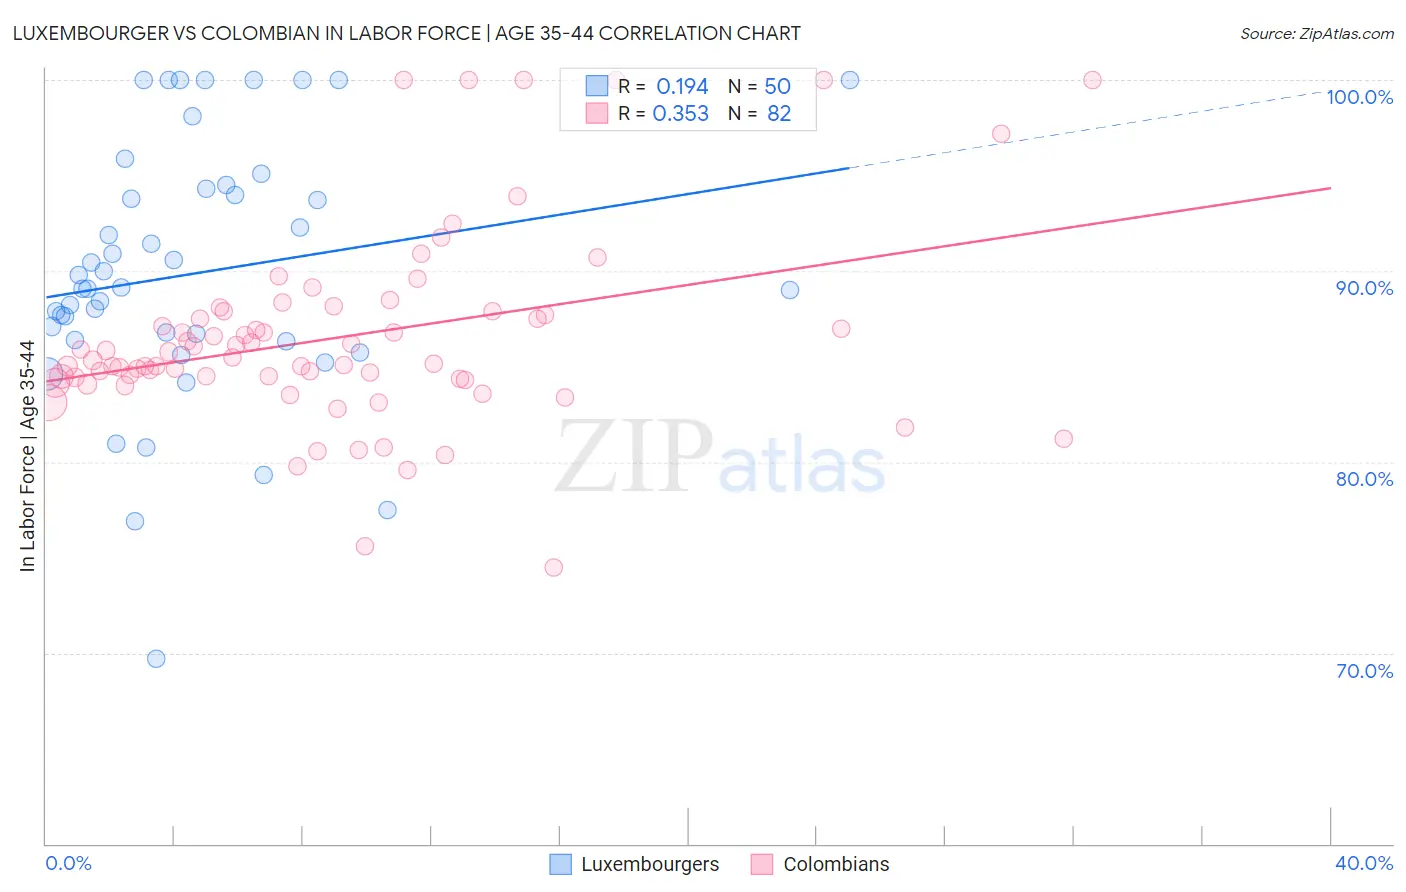
Luxembourger vs Colombian In Labor Force | Age 35-44 Correlation Chart
The statistical analysis conducted on geographies consisting of 144,662,796 people shows a poor positive correlation between the proportion of Luxembourgers and labor force participation rate among population between the ages 35 and 44 in the United States with a correlation coefficient (R) of 0.194 and weighted average of 86.4%. Similarly, the statistical analysis conducted on geographies consisting of 419,405,199 people shows a mild positive correlation between the proportion of Colombians and labor force participation rate among population between the ages 35 and 44 in the United States with a correlation coefficient (R) of 0.353 and weighted average of 85.0%, a difference of 1.7%.
In Labor Force | Age 35-44 Correlation Summary
| Measurement | Luxembourger | Colombian |
| Minimum | 69.7% | 74.5% |
| Maximum | 100.0% | 100.0% |
| Range | 30.3% | 25.5% |
| Mean | 89.9% | 86.6% |
| Median | 89.1% | 85.4% |
| Interquartile 25% (IQ1) | 86.4% | 84.3% |
| Interquartile 75% (IQ3) | 94.3% | 87.9% |
| Interquartile Range (IQR) | 7.9% | 3.6% |
| Standard Deviation (Sample) | 6.8% | 5.1% |
| Standard Deviation (Population) | 6.7% | 5.1% |
Similar Demographics by In Labor Force | Age 35-44
Demographics Similar to Luxembourgers by In Labor Force | Age 35-44
In terms of in labor force | age 35-44, the demographic groups most similar to Luxembourgers are Sierra Leonean (86.4%, a difference of 0.030%), Immigrants from Bolivia (86.2%, a difference of 0.19%), Immigrants from Cabo Verde (86.2%, a difference of 0.22%), Zimbabwean (86.1%, a difference of 0.35%), and Bolivian (86.1%, a difference of 0.36%).
| Demographics | Rating | Rank | In Labor Force | Age 35-44 |
| Sierra Leoneans | 100.0 /100 | #1 | Exceptional 86.4% |
| Luxembourgers | 100.0 /100 | #2 | Exceptional 86.4% |
| Immigrants | Bolivia | 100.0 /100 | #3 | Exceptional 86.2% |
| Immigrants | Cabo Verde | 100.0 /100 | #4 | Exceptional 86.2% |
| Zimbabweans | 100.0 /100 | #5 | Exceptional 86.1% |
| Bolivians | 100.0 /100 | #6 | Exceptional 86.1% |
| Immigrants | Sierra Leone | 100.0 /100 | #7 | Exceptional 86.1% |
| Immigrants | Ethiopia | 100.0 /100 | #8 | Exceptional 85.9% |
| Ethiopians | 100.0 /100 | #9 | Exceptional 85.9% |
| Cape Verdeans | 100.0 /100 | #10 | Exceptional 85.8% |
| Immigrants | Cameroon | 100.0 /100 | #11 | Exceptional 85.8% |
| Liberians | 100.0 /100 | #12 | Exceptional 85.7% |
| Somalis | 100.0 /100 | #13 | Exceptional 85.6% |
| Immigrants | Somalia | 100.0 /100 | #14 | Exceptional 85.6% |
| Norwegians | 100.0 /100 | #15 | Exceptional 85.6% |
Demographics Similar to Colombians by In Labor Force | Age 35-44
In terms of in labor force | age 35-44, the demographic groups most similar to Colombians are Immigrants from Singapore (85.0%, a difference of 0.010%), Immigrants from Sri Lanka (85.0%, a difference of 0.010%), Immigrants from South Central Asia (85.0%, a difference of 0.010%), Immigrants from Cuba (84.9%, a difference of 0.020%), and Immigrants from Turkey (84.9%, a difference of 0.020%).
| Demographics | Rating | Rank | In Labor Force | Age 35-44 |
| Immigrants | Italy | 99.1 /100 | #67 | Exceptional 85.0% |
| Italians | 99.1 /100 | #68 | Exceptional 85.0% |
| Sudanese | 99.0 /100 | #69 | Exceptional 85.0% |
| Brazilians | 99.0 /100 | #70 | Exceptional 85.0% |
| Russians | 99.0 /100 | #71 | Exceptional 85.0% |
| Immigrants | Singapore | 98.9 /100 | #72 | Exceptional 85.0% |
| Immigrants | Sri Lanka | 98.9 /100 | #73 | Exceptional 85.0% |
| Colombians | 98.8 /100 | #74 | Exceptional 85.0% |
| Immigrants | South Central Asia | 98.7 /100 | #75 | Exceptional 85.0% |
| Immigrants | Cuba | 98.6 /100 | #76 | Exceptional 84.9% |
| Immigrants | Turkey | 98.6 /100 | #77 | Exceptional 84.9% |
| Immigrants | Africa | 98.4 /100 | #78 | Exceptional 84.9% |
| Peruvians | 98.3 /100 | #79 | Exceptional 84.9% |
| Immigrants | Colombia | 98.3 /100 | #80 | Exceptional 84.9% |
| Immigrants | Eastern Europe | 98.3 /100 | #81 | Exceptional 84.9% |