Lithuanian vs Immigrants from Barbados In Labor Force | Age 16-19
COMPARE
Lithuanian
Immigrants from Barbados
In Labor Force | Age 16-19
In Labor Force | Age 16-19 Comparison
Lithuanians
Immigrants from Barbados
40.4%
IN LABOR FORCE | AGE 16-19
100.0/ 100
METRIC RATING
57th/ 347
METRIC RANK
29.0%
IN LABOR FORCE | AGE 16-19
0.0/ 100
METRIC RATING
342nd/ 347
METRIC RANK
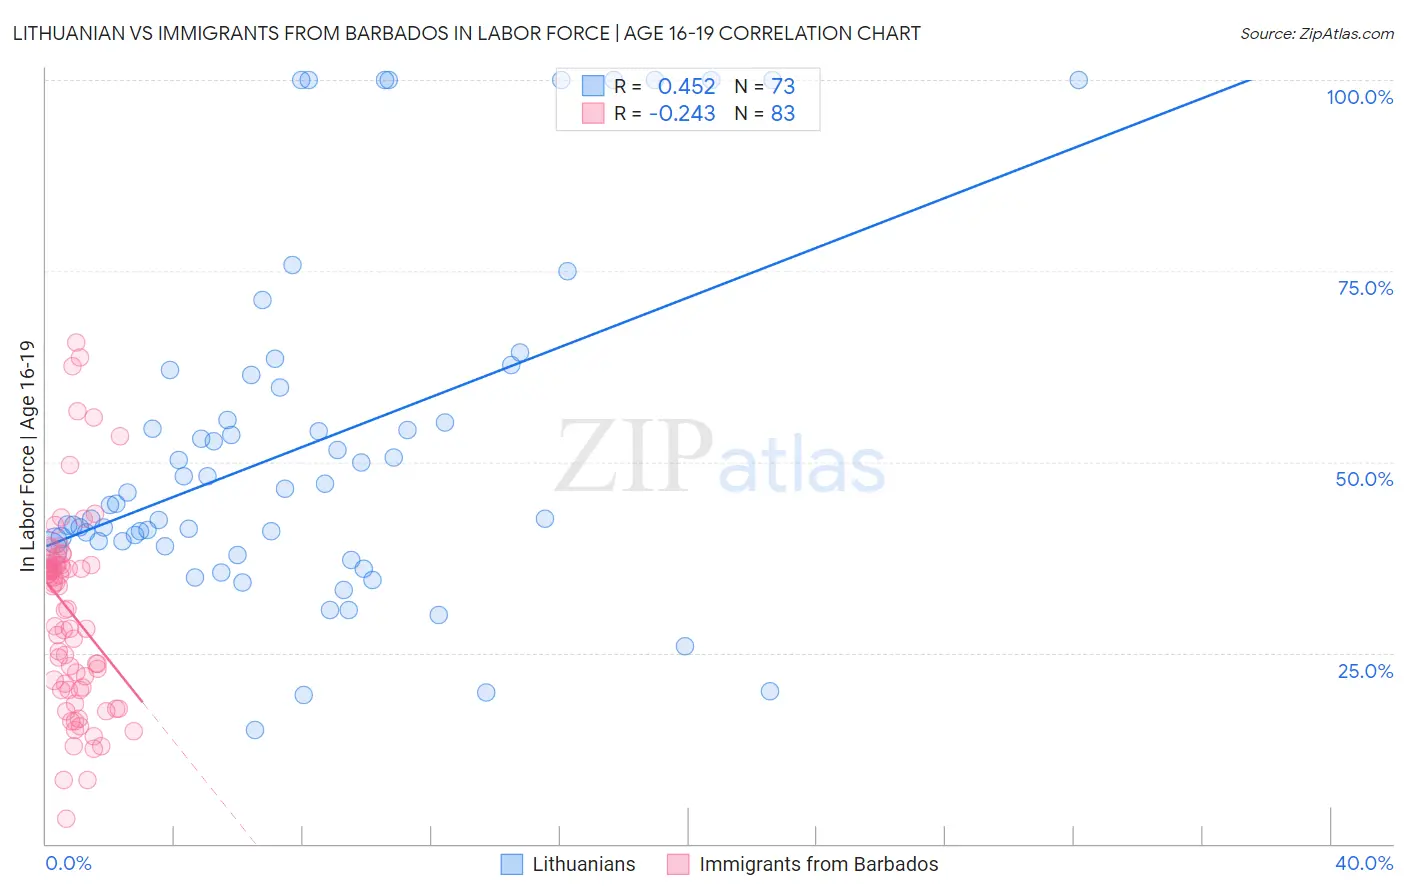
Lithuanian vs Immigrants from Barbados In Labor Force | Age 16-19 Correlation Chart
The statistical analysis conducted on geographies consisting of 420,922,487 people shows a moderate positive correlation between the proportion of Lithuanians and labor force participation rate among population between the ages 16 and 19 in the United States with a correlation coefficient (R) of 0.452 and weighted average of 40.4%. Similarly, the statistical analysis conducted on geographies consisting of 112,727,809 people shows a weak negative correlation between the proportion of Immigrants from Barbados and labor force participation rate among population between the ages 16 and 19 in the United States with a correlation coefficient (R) of -0.243 and weighted average of 29.0%, a difference of 39.5%.
In Labor Force | Age 16-19 Correlation Summary
| Measurement | Lithuanian | Immigrants from Barbados |
| Minimum | 15.0% | 3.3% |
| Maximum | 100.0% | 65.6% |
| Range | 85.0% | 62.3% |
| Mean | 52.1% | 30.3% |
| Median | 44.5% | 33.7% |
| Interquartile 25% (IQ1) | 39.3% | 20.2% |
| Interquartile 75% (IQ3) | 60.6% | 36.5% |
| Interquartile Range (IQR) | 21.2% | 16.3% |
| Standard Deviation (Sample) | 22.6% | 12.8% |
| Standard Deviation (Population) | 22.4% | 12.7% |
Similar Demographics by In Labor Force | Age 16-19
Demographics Similar to Lithuanians by In Labor Force | Age 16-19
In terms of in labor force | age 16-19, the demographic groups most similar to Lithuanians are Aleut (40.4%, a difference of 0.010%), Fijian (40.4%, a difference of 0.030%), British (40.5%, a difference of 0.11%), Tlingit-Haida (40.5%, a difference of 0.14%), and Slavic (40.4%, a difference of 0.15%).
| Demographics | Rating | Rank | In Labor Force | Age 16-19 |
| Indonesians | 100.0 /100 | #50 | Exceptional 40.7% |
| Immigrants | Zaire | 100.0 /100 | #51 | Exceptional 40.7% |
| Immigrants | Laos | 100.0 /100 | #52 | Exceptional 40.6% |
| Immigrants | Kenya | 100.0 /100 | #53 | Exceptional 40.5% |
| Tlingit-Haida | 100.0 /100 | #54 | Exceptional 40.5% |
| British | 100.0 /100 | #55 | Exceptional 40.5% |
| Fijians | 100.0 /100 | #56 | Exceptional 40.4% |
| Lithuanians | 100.0 /100 | #57 | Exceptional 40.4% |
| Aleuts | 100.0 /100 | #58 | Exceptional 40.4% |
| Slavs | 100.0 /100 | #59 | Exceptional 40.4% |
| Immigrants | Eastern Africa | 100.0 /100 | #60 | Exceptional 40.4% |
| Americans | 100.0 /100 | #61 | Exceptional 40.3% |
| Cherokee | 100.0 /100 | #62 | Exceptional 40.2% |
| Northern Europeans | 100.0 /100 | #63 | Exceptional 40.2% |
| Immigrants | Micronesia | 100.0 /100 | #64 | Exceptional 40.2% |
Demographics Similar to Immigrants from Barbados by In Labor Force | Age 16-19
In terms of in labor force | age 16-19, the demographic groups most similar to Immigrants from Barbados are Immigrants from Armenia (29.0%, a difference of 0.15%), British West Indian (29.1%, a difference of 0.38%), Immigrants from Uzbekistan (29.2%, a difference of 0.58%), Vietnamese (29.6%, a difference of 2.0%), and Immigrants from Bangladesh (30.0%, a difference of 3.7%).
| Demographics | Rating | Rank | In Labor Force | Age 16-19 |
| Immigrants | Hong Kong | 0.0 /100 | #333 | Tragic 30.5% |
| Puerto Ricans | 0.0 /100 | #334 | Tragic 30.3% |
| Immigrants | Cuba | 0.0 /100 | #335 | Tragic 30.2% |
| Immigrants | Trinidad and Tobago | 0.0 /100 | #336 | Tragic 30.2% |
| Immigrants | Bangladesh | 0.0 /100 | #337 | Tragic 30.0% |
| Vietnamese | 0.0 /100 | #338 | Tragic 29.6% |
| Immigrants | Uzbekistan | 0.0 /100 | #339 | Tragic 29.2% |
| British West Indians | 0.0 /100 | #340 | Tragic 29.1% |
| Immigrants | Armenia | 0.0 /100 | #341 | Tragic 29.0% |
| Immigrants | Barbados | 0.0 /100 | #342 | Tragic 29.0% |
| Yuman | 0.0 /100 | #343 | Tragic 27.7% |
| Guyanese | 0.0 /100 | #344 | Tragic 27.4% |
| Immigrants | Guyana | 0.0 /100 | #345 | Tragic 27.3% |
| Immigrants | St. Vincent and the Grenadines | 0.0 /100 | #346 | Tragic 26.3% |
| Immigrants | Grenada | 0.0 /100 | #347 | Tragic 25.4% |