West Indian vs Immigrants from Barbados In Labor Force | Age 16-19
COMPARE
West Indian
Immigrants from Barbados
In Labor Force | Age 16-19
In Labor Force | Age 16-19 Comparison
West Indians
Immigrants from Barbados
31.3%
IN LABOR FORCE | AGE 16-19
0.0/ 100
METRIC RATING
321st/ 347
METRIC RANK
29.0%
IN LABOR FORCE | AGE 16-19
0.0/ 100
METRIC RATING
342nd/ 347
METRIC RANK
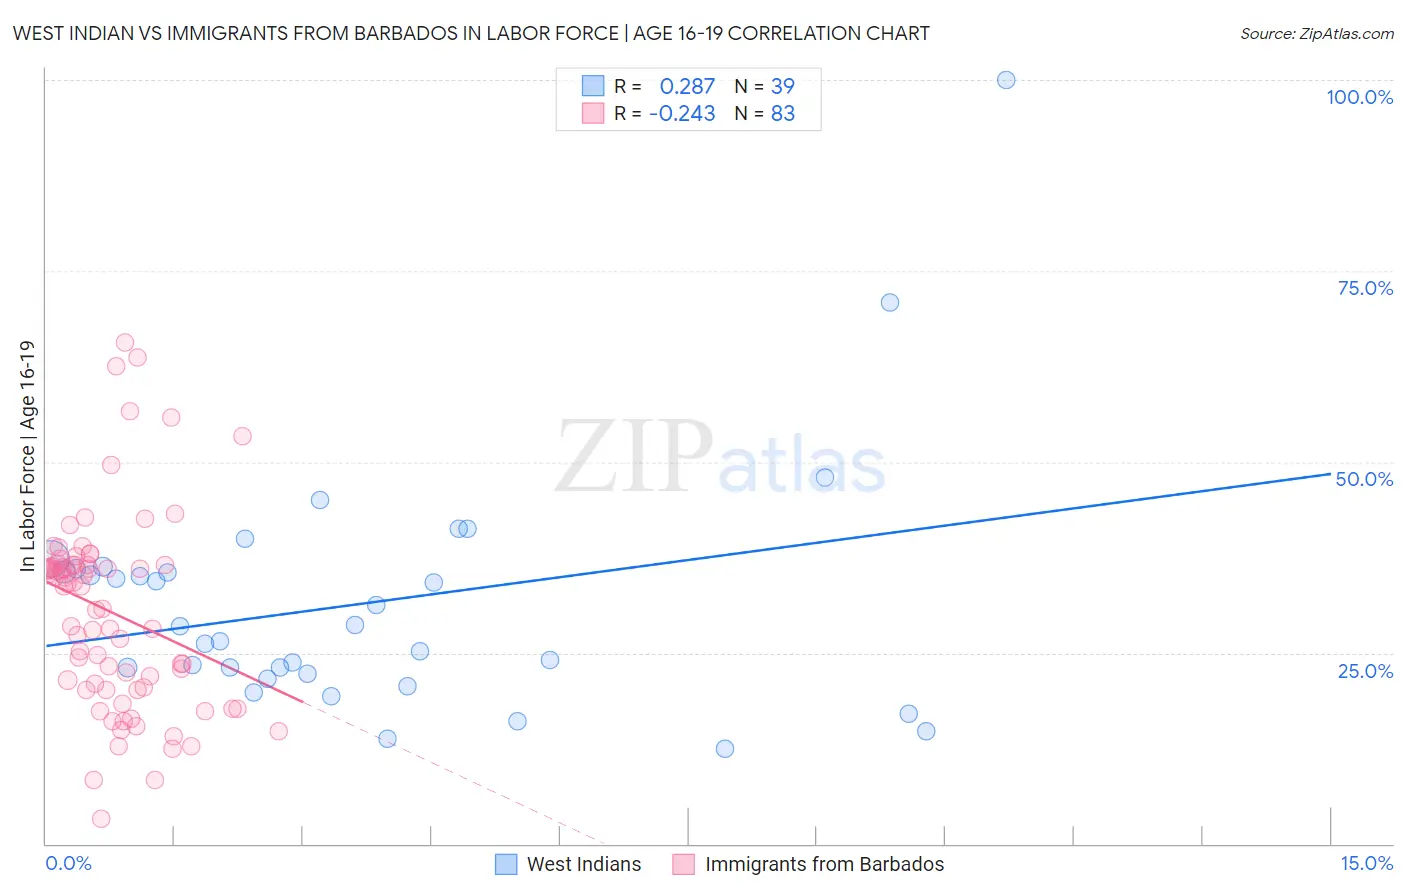
West Indian vs Immigrants from Barbados In Labor Force | Age 16-19 Correlation Chart
The statistical analysis conducted on geographies consisting of 253,845,757 people shows a weak positive correlation between the proportion of West Indians and labor force participation rate among population between the ages 16 and 19 in the United States with a correlation coefficient (R) of 0.287 and weighted average of 31.3%. Similarly, the statistical analysis conducted on geographies consisting of 112,727,809 people shows a weak negative correlation between the proportion of Immigrants from Barbados and labor force participation rate among population between the ages 16 and 19 in the United States with a correlation coefficient (R) of -0.243 and weighted average of 29.0%, a difference of 8.1%.
In Labor Force | Age 16-19 Correlation Summary
| Measurement | West Indian | Immigrants from Barbados |
| Minimum | 12.5% | 3.3% |
| Maximum | 100.0% | 65.6% |
| Range | 87.5% | 62.3% |
| Mean | 31.4% | 30.3% |
| Median | 28.5% | 33.7% |
| Interquartile 25% (IQ1) | 22.3% | 20.2% |
| Interquartile 75% (IQ3) | 35.9% | 36.5% |
| Interquartile Range (IQR) | 13.6% | 16.3% |
| Standard Deviation (Sample) | 15.9% | 12.8% |
| Standard Deviation (Population) | 15.7% | 12.7% |
Similar Demographics by In Labor Force | Age 16-19
Demographics Similar to West Indians by In Labor Force | Age 16-19
In terms of in labor force | age 16-19, the demographic groups most similar to West Indians are Tohono O'odham (31.3%, a difference of 0.12%), Ecuadorian (31.4%, a difference of 0.23%), Immigrants from Caribbean (31.2%, a difference of 0.25%), Soviet Union (31.4%, a difference of 0.30%), and Dominican (31.2%, a difference of 0.43%).
| Demographics | Rating | Rank | In Labor Force | Age 16-19 |
| Cubans | 0.0 /100 | #314 | Tragic 31.8% |
| Immigrants | West Indies | 0.0 /100 | #315 | Tragic 31.7% |
| Filipinos | 0.0 /100 | #316 | Tragic 31.7% |
| Immigrants | Nicaragua | 0.0 /100 | #317 | Tragic 31.6% |
| Immigrants | Yemen | 0.0 /100 | #318 | Tragic 31.5% |
| Soviet Union | 0.0 /100 | #319 | Tragic 31.4% |
| Ecuadorians | 0.0 /100 | #320 | Tragic 31.4% |
| West Indians | 0.0 /100 | #321 | Tragic 31.3% |
| Tohono O'odham | 0.0 /100 | #322 | Tragic 31.3% |
| Immigrants | Caribbean | 0.0 /100 | #323 | Tragic 31.2% |
| Dominicans | 0.0 /100 | #324 | Tragic 31.2% |
| Immigrants | China | 0.0 /100 | #325 | Tragic 31.1% |
| Immigrants | Dominican Republic | 0.0 /100 | #326 | Tragic 31.1% |
| Immigrants | Taiwan | 0.0 /100 | #327 | Tragic 31.0% |
| Immigrants | Ecuador | 0.0 /100 | #328 | Tragic 31.0% |
Demographics Similar to Immigrants from Barbados by In Labor Force | Age 16-19
In terms of in labor force | age 16-19, the demographic groups most similar to Immigrants from Barbados are Immigrants from Armenia (29.0%, a difference of 0.15%), British West Indian (29.1%, a difference of 0.38%), Immigrants from Uzbekistan (29.2%, a difference of 0.58%), Vietnamese (29.6%, a difference of 2.0%), and Immigrants from Bangladesh (30.0%, a difference of 3.7%).
| Demographics | Rating | Rank | In Labor Force | Age 16-19 |
| Immigrants | Hong Kong | 0.0 /100 | #333 | Tragic 30.5% |
| Puerto Ricans | 0.0 /100 | #334 | Tragic 30.3% |
| Immigrants | Cuba | 0.0 /100 | #335 | Tragic 30.2% |
| Immigrants | Trinidad and Tobago | 0.0 /100 | #336 | Tragic 30.2% |
| Immigrants | Bangladesh | 0.0 /100 | #337 | Tragic 30.0% |
| Vietnamese | 0.0 /100 | #338 | Tragic 29.6% |
| Immigrants | Uzbekistan | 0.0 /100 | #339 | Tragic 29.2% |
| British West Indians | 0.0 /100 | #340 | Tragic 29.1% |
| Immigrants | Armenia | 0.0 /100 | #341 | Tragic 29.0% |
| Immigrants | Barbados | 0.0 /100 | #342 | Tragic 29.0% |
| Yuman | 0.0 /100 | #343 | Tragic 27.7% |
| Guyanese | 0.0 /100 | #344 | Tragic 27.4% |
| Immigrants | Guyana | 0.0 /100 | #345 | Tragic 27.3% |
| Immigrants | St. Vincent and the Grenadines | 0.0 /100 | #346 | Tragic 26.3% |
| Immigrants | Grenada | 0.0 /100 | #347 | Tragic 25.4% |