Lithuanian vs Immigrants from Barbados Female Poverty
COMPARE
Lithuanian
Immigrants from Barbados
Female Poverty
Female Poverty Comparison
Lithuanians
Immigrants from Barbados
11.4%
FEMALE POVERTY
99.8/ 100
METRIC RATING
14th/ 347
METRIC RANK
16.0%
FEMALE POVERTY
0.0/ 100
METRIC RATING
275th/ 347
METRIC RANK
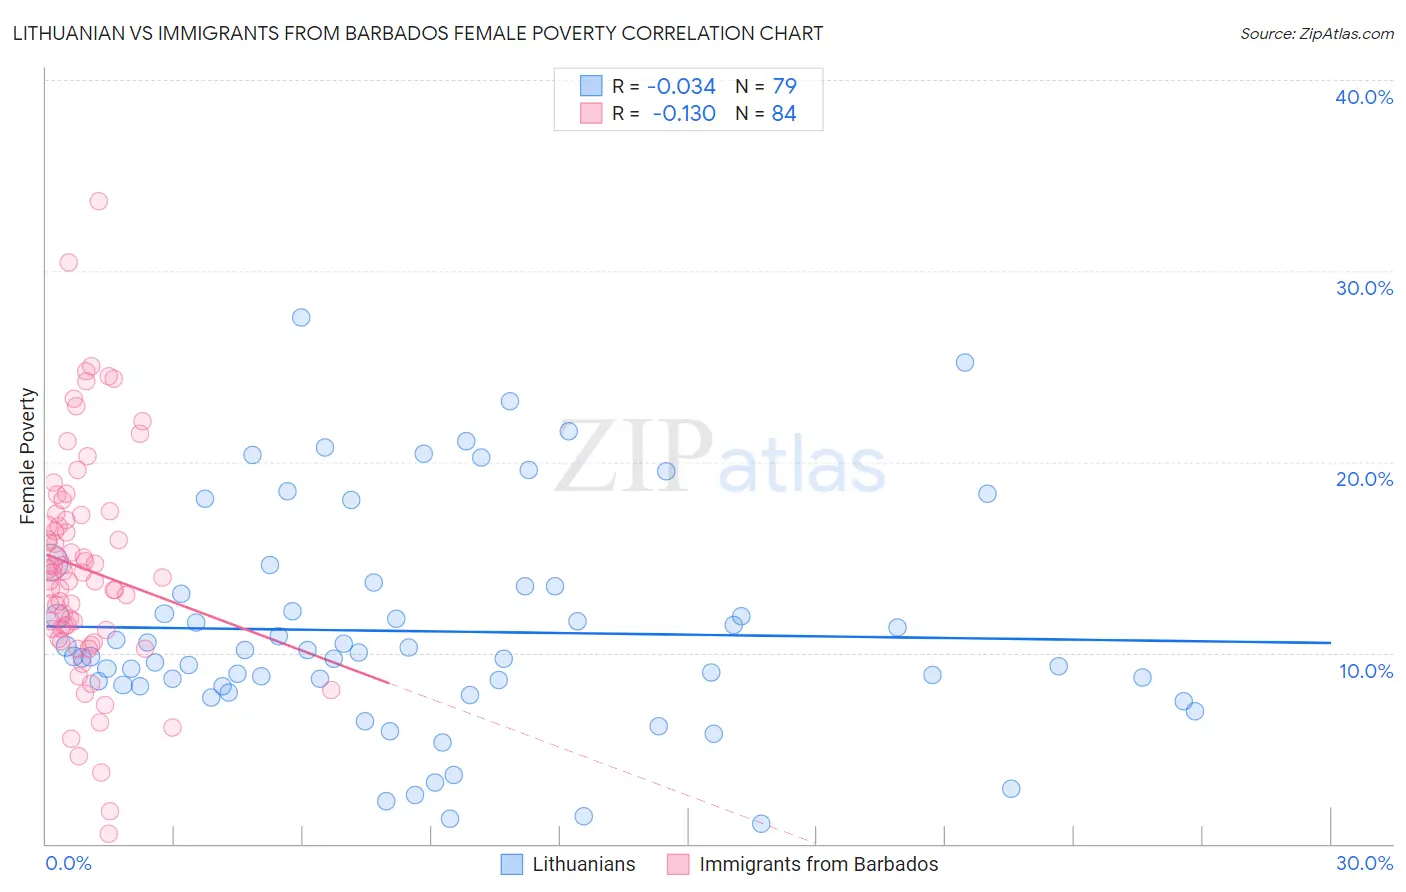
Lithuanian vs Immigrants from Barbados Female Poverty Correlation Chart
The statistical analysis conducted on geographies consisting of 421,598,229 people shows no correlation between the proportion of Lithuanians and poverty level among females in the United States with a correlation coefficient (R) of -0.034 and weighted average of 11.4%. Similarly, the statistical analysis conducted on geographies consisting of 112,761,871 people shows a poor negative correlation between the proportion of Immigrants from Barbados and poverty level among females in the United States with a correlation coefficient (R) of -0.130 and weighted average of 16.0%, a difference of 40.0%.
Female Poverty Correlation Summary
| Measurement | Lithuanian | Immigrants from Barbados |
| Minimum | 1.0% | 0.50% |
| Maximum | 27.5% | 33.6% |
| Range | 26.5% | 33.1% |
| Mean | 11.1% | 14.4% |
| Median | 9.8% | 14.1% |
| Interquartile 25% (IQ1) | 8.2% | 11.2% |
| Interquartile 75% (IQ3) | 13.5% | 17.1% |
| Interquartile Range (IQR) | 5.2% | 5.8% |
| Standard Deviation (Sample) | 5.7% | 5.9% |
| Standard Deviation (Population) | 5.6% | 5.8% |
Similar Demographics by Female Poverty
Demographics Similar to Lithuanians by Female Poverty
In terms of female poverty, the demographic groups most similar to Lithuanians are Latvian (11.4%, a difference of 0.32%), Immigrants from Bolivia (11.5%, a difference of 0.80%), Bolivian (11.5%, a difference of 0.87%), Immigrants from Scotland (11.5%, a difference of 0.92%), and Immigrants from Lithuania (11.3%, a difference of 0.96%).
| Demographics | Rating | Rank | Female Poverty |
| Assyrians/Chaldeans/Syriacs | 99.9 /100 | #7 | Exceptional 11.0% |
| Immigrants | South Central Asia | 99.9 /100 | #8 | Exceptional 11.1% |
| Bulgarians | 99.9 /100 | #9 | Exceptional 11.1% |
| Immigrants | Hong Kong | 99.9 /100 | #10 | Exceptional 11.2% |
| Maltese | 99.9 /100 | #11 | Exceptional 11.2% |
| Bhutanese | 99.9 /100 | #12 | Exceptional 11.3% |
| Immigrants | Lithuania | 99.9 /100 | #13 | Exceptional 11.3% |
| Lithuanians | 99.8 /100 | #14 | Exceptional 11.4% |
| Latvians | 99.8 /100 | #15 | Exceptional 11.4% |
| Immigrants | Bolivia | 99.8 /100 | #16 | Exceptional 11.5% |
| Bolivians | 99.8 /100 | #17 | Exceptional 11.5% |
| Immigrants | Scotland | 99.8 /100 | #18 | Exceptional 11.5% |
| Norwegians | 99.8 /100 | #19 | Exceptional 11.5% |
| Eastern Europeans | 99.7 /100 | #20 | Exceptional 11.5% |
| Italians | 99.7 /100 | #21 | Exceptional 11.6% |
Demographics Similar to Immigrants from Barbados by Female Poverty
In terms of female poverty, the demographic groups most similar to Immigrants from Barbados are Belizean (15.9%, a difference of 0.070%), Haitian (15.9%, a difference of 0.070%), Barbadian (15.9%, a difference of 0.070%), Central American (16.0%, a difference of 0.13%), and Immigrants from St. Vincent and the Grenadines (15.9%, a difference of 0.30%).
| Demographics | Rating | Rank | Female Poverty |
| Immigrants | Nicaragua | 0.1 /100 | #268 | Tragic 15.8% |
| Iroquois | 0.1 /100 | #269 | Tragic 15.8% |
| Chickasaw | 0.1 /100 | #270 | Tragic 15.9% |
| Immigrants | St. Vincent and the Grenadines | 0.0 /100 | #271 | Tragic 15.9% |
| Belizeans | 0.0 /100 | #272 | Tragic 15.9% |
| Haitians | 0.0 /100 | #273 | Tragic 15.9% |
| Barbadians | 0.0 /100 | #274 | Tragic 15.9% |
| Immigrants | Barbados | 0.0 /100 | #275 | Tragic 16.0% |
| Central Americans | 0.0 /100 | #276 | Tragic 16.0% |
| Bangladeshis | 0.0 /100 | #277 | Tragic 16.0% |
| Immigrants | West Indies | 0.0 /100 | #278 | Tragic 16.1% |
| Immigrants | Bahamas | 0.0 /100 | #279 | Tragic 16.1% |
| Vietnamese | 0.0 /100 | #280 | Tragic 16.1% |
| West Indians | 0.0 /100 | #281 | Tragic 16.1% |
| Immigrants | Haiti | 0.0 /100 | #282 | Tragic 16.1% |