Shoshone vs Immigrants from Barbados In Labor Force | Age 16-19
COMPARE
Shoshone
Immigrants from Barbados
In Labor Force | Age 16-19
In Labor Force | Age 16-19 Comparison
Shoshone
Immigrants from Barbados
39.3%
IN LABOR FORCE | AGE 16-19
99.7/ 100
METRIC RATING
81st/ 347
METRIC RANK
29.0%
IN LABOR FORCE | AGE 16-19
0.0/ 100
METRIC RATING
342nd/ 347
METRIC RANK
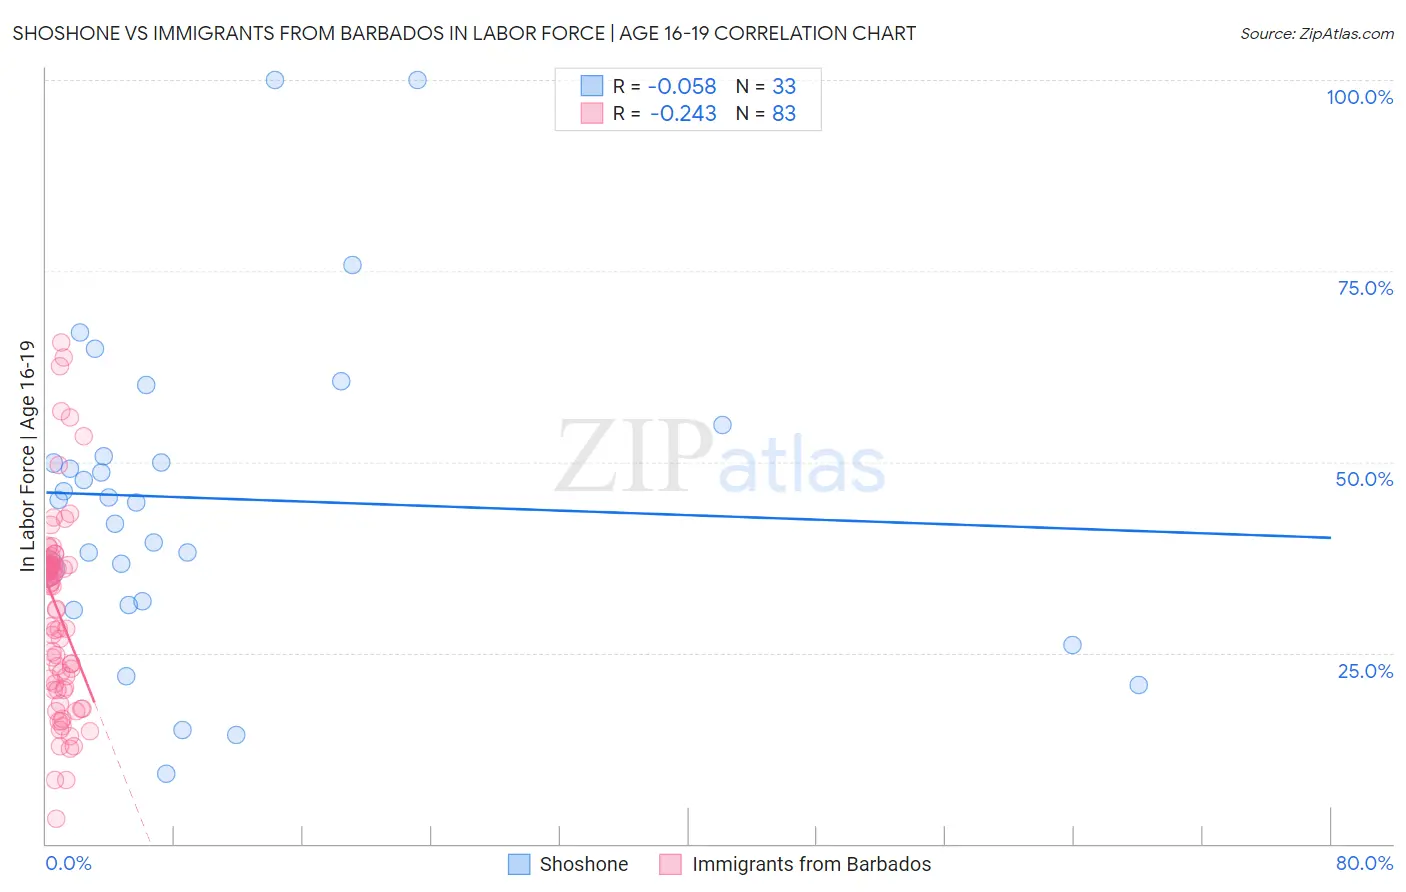
Shoshone vs Immigrants from Barbados In Labor Force | Age 16-19 Correlation Chart
The statistical analysis conducted on geographies consisting of 66,564,469 people shows a slight negative correlation between the proportion of Shoshone and labor force participation rate among population between the ages 16 and 19 in the United States with a correlation coefficient (R) of -0.058 and weighted average of 39.3%. Similarly, the statistical analysis conducted on geographies consisting of 112,727,809 people shows a weak negative correlation between the proportion of Immigrants from Barbados and labor force participation rate among population between the ages 16 and 19 in the United States with a correlation coefficient (R) of -0.243 and weighted average of 29.0%, a difference of 35.5%.
In Labor Force | Age 16-19 Correlation Summary
| Measurement | Shoshone | Immigrants from Barbados |
| Minimum | 9.1% | 3.3% |
| Maximum | 100.0% | 65.6% |
| Range | 90.9% | 62.3% |
| Mean | 45.2% | 30.3% |
| Median | 45.1% | 33.7% |
| Interquartile 25% (IQ1) | 31.5% | 20.2% |
| Interquartile 75% (IQ3) | 52.7% | 36.5% |
| Interquartile Range (IQR) | 21.2% | 16.3% |
| Standard Deviation (Sample) | 20.9% | 12.8% |
| Standard Deviation (Population) | 20.6% | 12.7% |
Similar Demographics by In Labor Force | Age 16-19
Demographics Similar to Shoshone by In Labor Force | Age 16-19
In terms of in labor force | age 16-19, the demographic groups most similar to Shoshone are Basque (39.3%, a difference of 0.060%), Spanish (39.3%, a difference of 0.080%), Immigrants from Uganda (39.2%, a difference of 0.21%), Immigrants from Iraq (39.4%, a difference of 0.28%), and Creek (39.1%, a difference of 0.36%).
| Demographics | Rating | Rank | In Labor Force | Age 16-19 |
| Hungarians | 99.9 /100 | #74 | Exceptional 39.8% |
| French American Indians | 99.9 /100 | #75 | Exceptional 39.8% |
| Malaysians | 99.9 /100 | #76 | Exceptional 39.7% |
| Immigrants | Portugal | 99.9 /100 | #77 | Exceptional 39.7% |
| Austrians | 99.8 /100 | #78 | Exceptional 39.5% |
| Marshallese | 99.8 /100 | #79 | Exceptional 39.5% |
| Immigrants | Iraq | 99.8 /100 | #80 | Exceptional 39.4% |
| Shoshone | 99.7 /100 | #81 | Exceptional 39.3% |
| Basques | 99.7 /100 | #82 | Exceptional 39.3% |
| Spanish | 99.7 /100 | #83 | Exceptional 39.3% |
| Immigrants | Uganda | 99.7 /100 | #84 | Exceptional 39.2% |
| Creek | 99.6 /100 | #85 | Exceptional 39.1% |
| Samoans | 99.6 /100 | #86 | Exceptional 39.1% |
| Immigrants | Germany | 99.6 /100 | #87 | Exceptional 39.1% |
| Puget Sound Salish | 99.6 /100 | #88 | Exceptional 39.1% |
Demographics Similar to Immigrants from Barbados by In Labor Force | Age 16-19
In terms of in labor force | age 16-19, the demographic groups most similar to Immigrants from Barbados are Immigrants from Armenia (29.0%, a difference of 0.15%), British West Indian (29.1%, a difference of 0.38%), Immigrants from Uzbekistan (29.2%, a difference of 0.58%), Vietnamese (29.6%, a difference of 2.0%), and Immigrants from Bangladesh (30.0%, a difference of 3.7%).
| Demographics | Rating | Rank | In Labor Force | Age 16-19 |
| Immigrants | Hong Kong | 0.0 /100 | #333 | Tragic 30.5% |
| Puerto Ricans | 0.0 /100 | #334 | Tragic 30.3% |
| Immigrants | Cuba | 0.0 /100 | #335 | Tragic 30.2% |
| Immigrants | Trinidad and Tobago | 0.0 /100 | #336 | Tragic 30.2% |
| Immigrants | Bangladesh | 0.0 /100 | #337 | Tragic 30.0% |
| Vietnamese | 0.0 /100 | #338 | Tragic 29.6% |
| Immigrants | Uzbekistan | 0.0 /100 | #339 | Tragic 29.2% |
| British West Indians | 0.0 /100 | #340 | Tragic 29.1% |
| Immigrants | Armenia | 0.0 /100 | #341 | Tragic 29.0% |
| Immigrants | Barbados | 0.0 /100 | #342 | Tragic 29.0% |
| Yuman | 0.0 /100 | #343 | Tragic 27.7% |
| Guyanese | 0.0 /100 | #344 | Tragic 27.4% |
| Immigrants | Guyana | 0.0 /100 | #345 | Tragic 27.3% |
| Immigrants | St. Vincent and the Grenadines | 0.0 /100 | #346 | Tragic 26.3% |
| Immigrants | Grenada | 0.0 /100 | #347 | Tragic 25.4% |